State Change Log
The State Change Log, displays a chronological log of the changes in state for the instances in the selected application, or profile; or for the selected component, when a single component is selected.
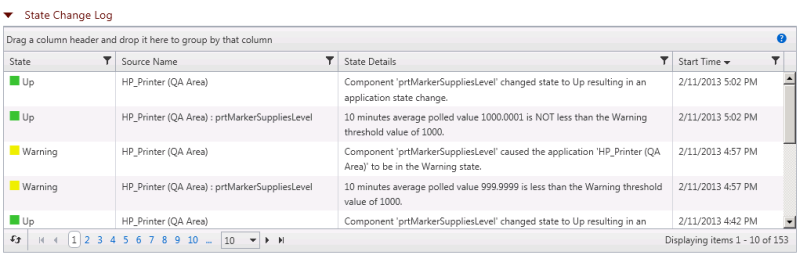
- State. Displays the state (Up, Down, Warning, Maintenance, Disabled, or Unknown) to which the instance or component entered at the start time.
- Source Name. Displays the name of the instance or component.
- State Details. Displays details gathered about the state change.
- Start Time. Displays the time which the source entered the indicated state.
Grouping and filtering data
You can group the State Change Log by any column. To group the output by a column, drag a column header to the grid header. You can group by more than one criteria by dragging more than one column header to the grid header. The grid is ordered by all of the groupings appearing in the grid header, from left to right. To remove a grouping, close the grouping you want to remove.
You can also filter the State Change Log based on criteria defined using the filter icon ![]() in each column.
in each column.
The Polled Values report is used to display data from components that return values when polled to which APM applies thresholds to determine the state.
To filter the report:
- Click the filter icon
 in the column containing the value on which you want to filter. The filter creation dialog appears.
 - Select the filter operation you want to use to create the filter criteria.
- Enter the value you want the filter operation to use to create the filter criteria.
- Click Filter to apply the filter to the entries in the report.
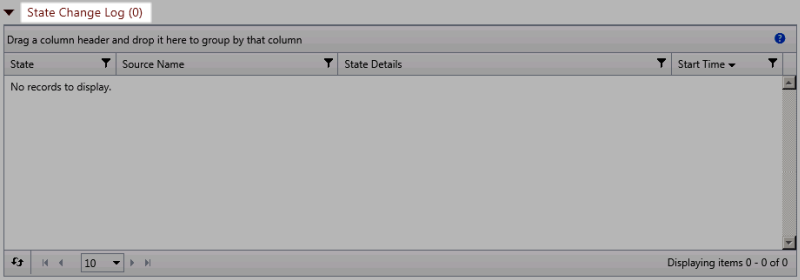
If no state changes have taken place, the number zero is displayed in parenthesis next to the report title.