About the Top 10 dashboard
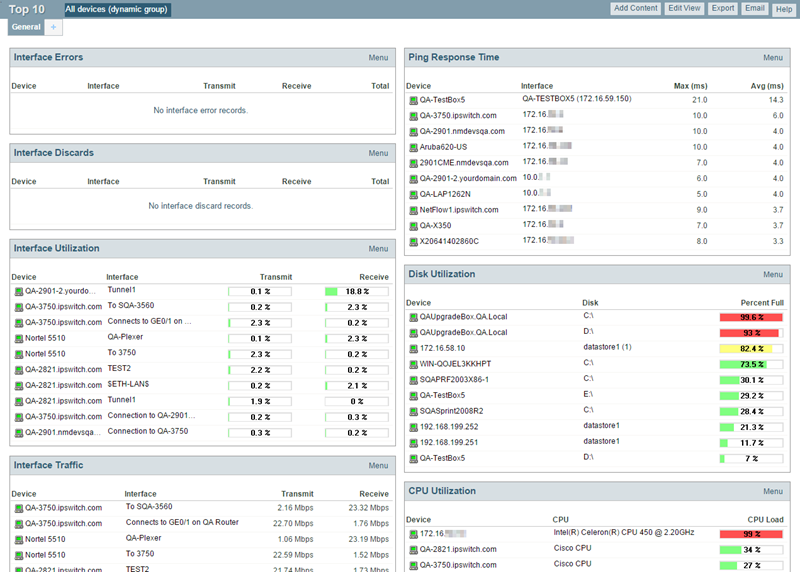
The WhatsUp Gold Top 10 dashboard displays Top 10 reports for your network devices. The Top 10 dashboard shows devices, at a glance, that may be potential problems and to provide information on the current health of your network devices.
You can add any of the Top 10 reports to the Top 10 dashboard.
Unlike the Home and Device dashboards, the Top 10 dashboard is designed with only the General dashboard view. You can customize the general view in the same way you can other dashboard views by removing the default dashboard reports and/or adding other Top 10 and Threshold dashboard reports.
- Add the reports you want to see here by clicking Add Content. For more information, see Adding dashboard reports to a dashboard view.
- Change options for individual reports by clicking Menu > Configure for each report.
- Add additional views by clicking the plus sign (+). Remove views by dragging them to the trash. For more information, see Working with dashboard views.
The Top 10 dashboard also displays threshold reports. These reports let you set a threshold to filter out items that do not match a specified criteria. For example, the Interface Utilization Threshold report could have been used (in the example above) instead of the Interface Top 10 report, to filter out the interfaces that are not above 50% utilization. Using this approach, only interfaces with significant usage would be shown.
Thresholds
Report percentages are displayed in colors that represent the utilization thresholds:
- Red. Above 90%
- Yellow. Above 80%
- Green. 80% or less