Filtering by drilling-down
Another way to filter report data is by clicking on report entries, or drilling-down. This method of report-filtering allows you to dig deeper into data that peaks your interest or raises red flags—with just one click.
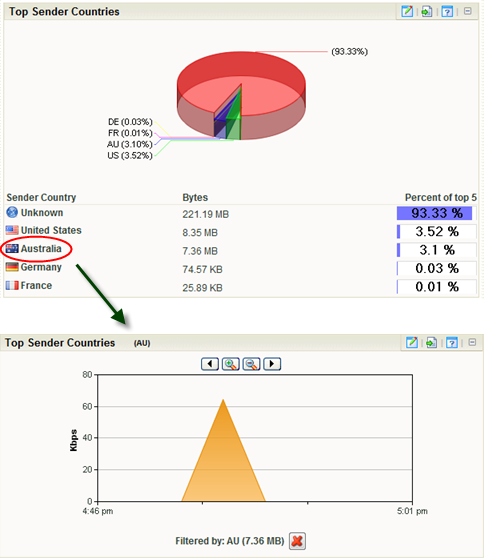
When you click an entry in the farthest-left column of an Interface Details dashboard report, the report reloads using the entry as a filter. Also, you can click inside a dashboard graph area to apply a filter.
Similarly to filtering by keywords, after you apply a filter to the report, the dashboard report that coincides with the filter will display a time graph for the filtered traffic component. For example, if you click an entry in the Sender Country column of the Top Sender Countries dashboard report, the dashboard report reloads with a time graph for the country that you clicked.
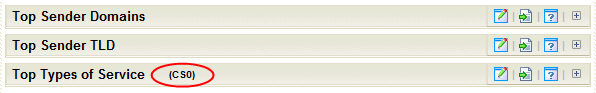
Several keyword filters coincide with more than one dashboard report and more than one time graph is displayed after the filter is applied. You can easily distinguish which dashboard reports in the Interface Details report are displaying time graphs by looking for the applied filter's name in parenthesis next to a report name.