Using the Performance Monitor Library
The Performance Monitor Library stores and displays the performance monitors that have been created for WhatsUp Gold. Performance monitors gather information about specific WMI and SNMP values from network devices. There are several default performance monitors available in the library and you can also add new performance monitors. Performance monitors can be applied to devices from the Device Properties dialog for that device.
To access the Performance Monitor Library:
- From the WhatsUp Gold web interface, go to Admin > Monitors. The Monitor Library dialog appears.
- If it is not already selected, click the Performance tab.
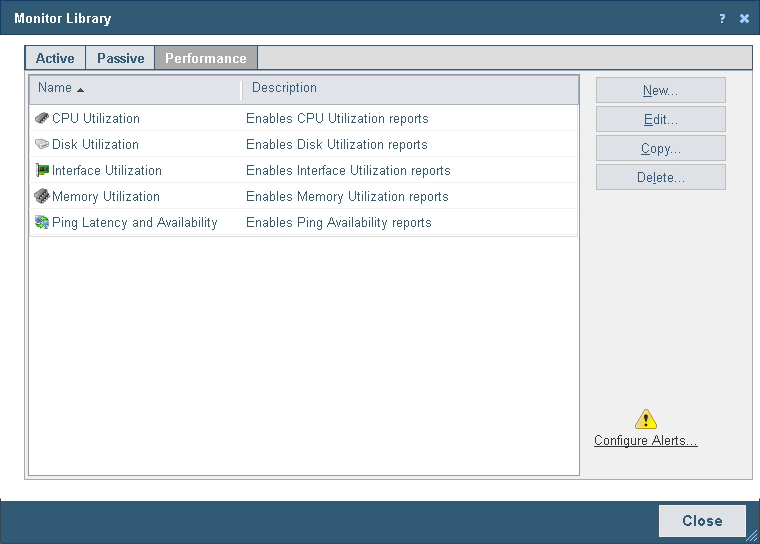
- Use the Performance Monitor Library dialog to configure new or existing performance monitor types:
- Click New to configure a custom performance monitor.
- Select an existing performance monitor, then click Edit to modify its configuration.
- Click Copy to create a duplicate of a monitor. You can use the Copy option to create new monitors based on existing monitors.
Note: The five default global monitors cannot be edited, copied or deleted: CPU Utilization, Disk Utilization, Interface Utilization, and Ping Latency and Availability.
- Select an existing performance monitor, then click Delete to remove it from the list.
Caution: When you delete a performance monitor from the Performance Monitor Library, any instance of that monitor is also deleted, and all related report data is also lost.
- Click Configure Alerts to view the Alert Center Threshold Library.
For more information on Performance Monitors, see Enabling performance monitors.