Viewing application performance status
The APM Status page allows you to view the performance status for the applications you are currently monitoring with Application Performance Monitor.
To access the APM Status page, go to APM > Status.
On the left of the Status page, the Application tree provides a way to determine the scope of the data provided in the right-hand content pane, as well as to provide the status of instances and components. The tree has a root that provides information on All Applications monitored by APM. Below this root, there are four levels:
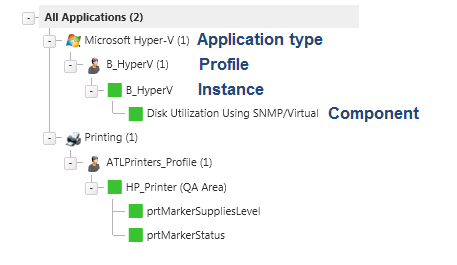
- Application Type. Groups application profiles, instances, and components by the type of application (e.g. SQL Server, IIS, Windows 2008 Server).
- Profile. Groups the instances and components by the profile used to create the individual instance. Where the data points being monitored are different between two versions of the same application, there may be separate application profiles for each version.
- Instance. Groups the components used to monitor the individual data points described in the profile.
- Component. Details each component used to monitor the data points associated with the application instance.
The status of the instance or component is displayed in the Application tree. The following table describes the icons used to display status:
Icon |
Status |
|
Indicates that the instance or component is in the Up state. |
|
Indicates that the instance or component is in the Down state. A component is in a Down state if it has exceeded the Down threshold set in the application profile. An instance is in a Down state if one or more critical component or critical component group is in a Down state. |
|
Indicates that the instance or component is in the Warning state. A component is in a Warning state if it has exceeded the Warning threshold set in the application profile. An instance is in a Warning state if one or more components or component groups are in a Warning state. |
|
Indicates that the instance or component is in an Maintenance state. |
|
Indicates that the component has been disabled. |
|
Indicates that the instance or component is in Unknown state. |
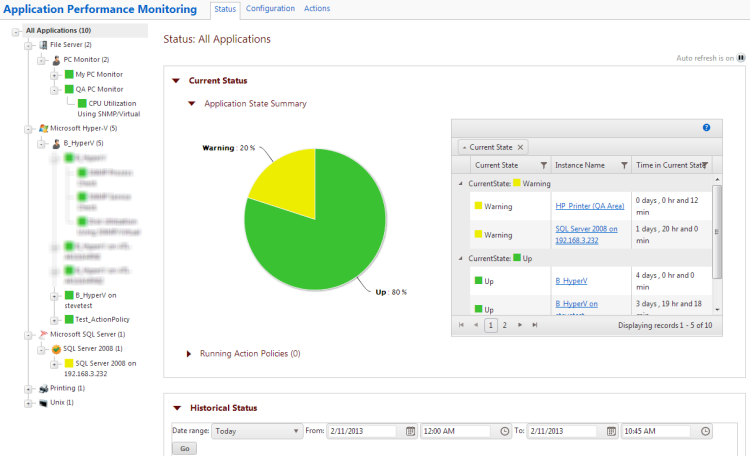
There are two collapsible sections that make up the content pane of the status page.
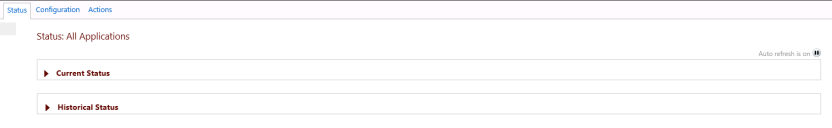
The top section, Current Status, provides summary information about applications or components and a list of the running Action Policies. The bottom section, Historical Status, provides a view into the availability, state change, instance and component summary information, as well as actions and resolved items over a defined time period.
Tip: Click the arrows to the left of a section name to expand or collapse the information in that section.
Please note that any reporting and log activity for any application profile or profile type selected on the APM Status page includes data for all components and groups under your selection in the navigation tree. This functionality can be limited to improve performance by accessing the APM Application Settings and clearing the Component and group data check box.
For flow charts and step-by-step information about configuring APM, see Getting Started with APM.