Component State Summary
The Component State Summary, on the Status tab, provides a summary of the current states of the components monitored by APM, based on the component selected in the Application Tree.
There are two elements of the Component State Summary, the first is the Current State chart, a pie-chart of the percentage of the components that are currently in a particular state, and the second is the Current State grid, a grid with each component in the selected instance, its current state, and amount of time the component has been in that state.
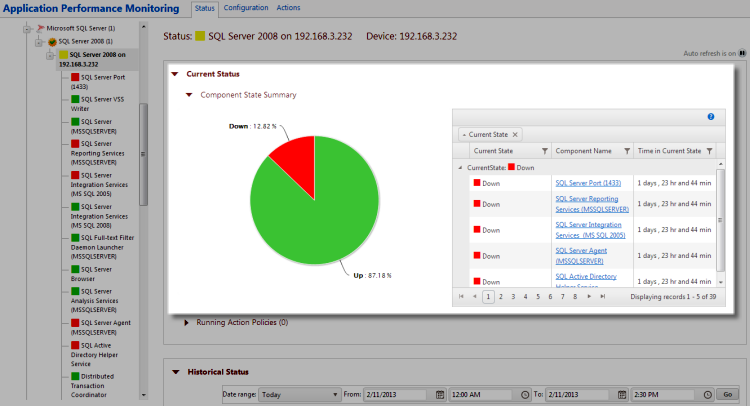
The Component Current State chart is a pie-chart that details the percentage of the components that are in a given state (Up, Down, Warning, Maintenance, Disabled, or Unknown). The following table details the value represented by the Current State chart.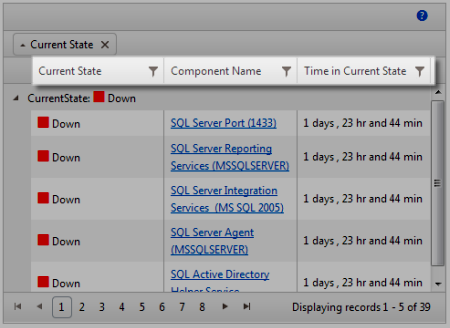
The Current State grid shows the current state of all of the components associated with the selected instance.
- Current State. The current state (Up, Down, Warning, Maintenance, Disabled, or Unknown).
- Component Name. The name of the component.
- Time in Current State. The amount of time the component has been in the current state.
Grouping and filtering data
You can group the Current State grid report by any column. To group the output by a column, drag a column header to the grid header. You can group for more than one criteria by dragging more than one column header to the grid header. The grid is ordered by all of the groupings appearing in the grid header, from left to right. To remove a grouping, close the grouping you want to remove. Click on the filter icon ![]() to create a filter on data displayed in the column.
to create a filter on data displayed in the column.