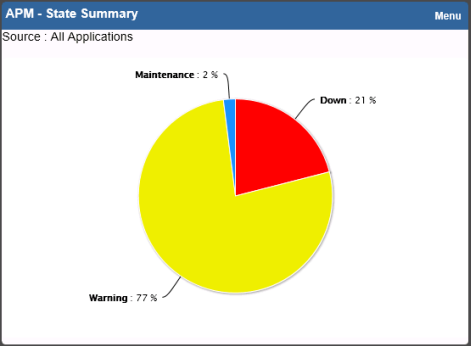
About the APM: State Summary Dashboard Report
The State Summary dashboard report displays a pie chart depicting the application state of a selected application profile type, application profile, or application instance.
To configure the State Summary dashboard report:
- From the State Summary dashboard report, click Menu > Configure. A Configure Menu dialog appears.
- Click browse (...) to launch a dialog showing the APM navigation tree.
- Select an application profile type, application profile, or application instance for display in the dashboard report.
Important: Summary data for any profile type, application profile, or application instance selected includes data for all components and groups under your selection in the navigation tree.
- Click OK.
- (Optional) Modify the Report name, Width, and/or Height of the dashboard report using the applicable boxes.
- Click OK.