About the APM: Application Event Log Dashboard Report
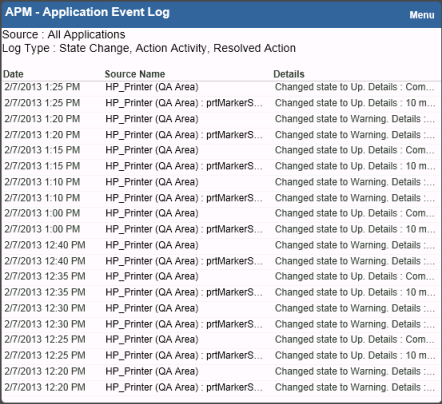
The Application Event Log dashboard report displays state change, action activity and action resolution information for a selected application profile type, application profile, or application instance.
To configure the Application Event Log dashboard report:
- From the Application Event Log dashboard report, click Menu > Configure. A Configure Menu dialog appears.
- Click browse (...) to launch a dialog showing the APM navigation tree.
- Select an application profile type, application profile, or application instance for display in the dashboard report.
Important: Summary data for any profile type, application profile, or application instance selected includes data for all components and groups under your selection in the navigation tree.
- Click OK.
- (Optional) Modify the Report name, Select Max items, Width, and/or Height of the dashboard report using the applicable boxes.
- (Optional) Enable/Disable the Event Log Types to be displayed within the dashboard report by clicking the applicable check boxes. Options are State Change, Action Activity, and Resolved Action.
- (Optional) Click the Show Source Type Column check box to display the source of the state change or action for your selection within the dashboard report.
- Click OK.