About the Flow Log
The Flow Monitor Log is a history of system-wide messages generated by Flow Monitor. When you access the Flow Monitor Log, it shows messages generated during the time period selected at the top of the report. By default, logs are generated at every data flush interval, including statistics about the data saved in the database and the time needed to complete the operation. These log entries provide valuable information about the collection, allowing us to know whether Flow Monitor is handling the load with ease.
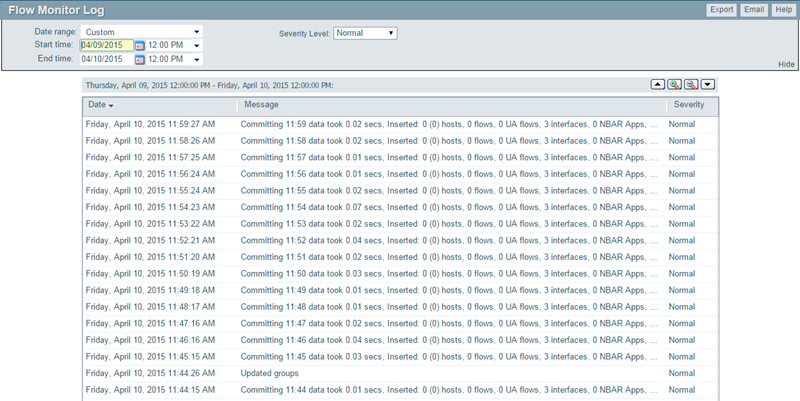
Each entry shows the date logged, the message about the activity, and the severity of the entry.
- Date displays the date the message was logged.
- Message displays the activity message. This message contains the reason for the log entry, other information, such as error number, which may be useful in troubleshooting.
- Severity displays the logging level of the entries, either Normal, Verbose, or Errors Only.
Tip: You can sort the data in the report by clicking on a column title.
Changing the report date and time
Use the Date range list at the top of the report to select a time frame for the report. By default, the report displays log entries for the previous hour.
Note: Flow Monitor only displays data from one database at a time, and by default, displays the most current data. If you select a time period that includes data stored in both the Flow Monitor database and the Flow Monitor Archive database, a note displays below the date range informing you that not all data is shown for the specified date range. For example, if you select a date that includes 39 days of archived data, and one hour of current data, one hour of current data is displayed in the report. You must modify the report's date to view the archived data.
Changing the report severity/logging level
Use the Severity level list to select a logging level for the report.
- Verbose displays all entries (including all three severity levels).
- Normal displays entries for Normal and Errors Only.
- Errors only displays only error entries.
Note: The logging level that you specify on the Flow Settings dialog determines the level of data that Flow Monitor records, whereas the logging level that you specify on the Flow Log report page determines the level of data displayed within the report.
Important: If you have specified the Normal or Errors Only levels on the Flow Settings dialog, you will not be able to view the Verbose level from the Flow Log report page.
Important: If your log includes an error that reads "It seems the collector is unable to keep up with the amount of traffic received," the amount of traffic you are currently collecting is too great for the Flow Monitor to handle. It is possible that you have a number of Flow sources and/or interfaces too great for the collector to handle. In an effort to reduce traffic, it will help to reduce the percentage of traffic to retain or the number of enabled sources and/or interfaces.
Exporting, emailing, scheduling and managing reports
- Click Export, at the top right of the page, to export reports. Click Email to E-mail a report or to manage Scheduled Reports. For more information see, Using Scheduled Reports in Flow Monitor: printing, exporting, and emailing reports.