Viewing historical status
The Historical Status section of the status page provides data about the availability, state change, actions, and resolved items during a defined time period.
The reports available in the Historical Status section are listed below:
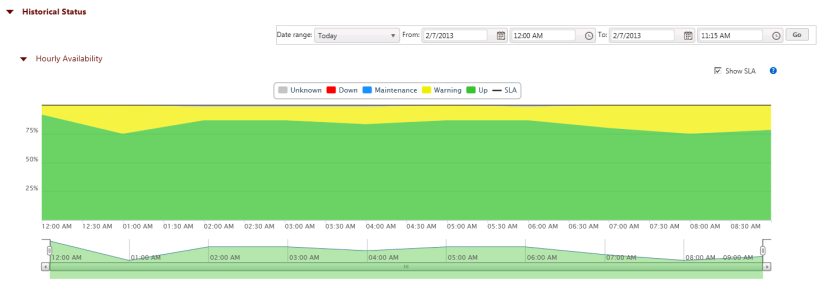
- Hourly Availability. Displays the percentage of the application instances or components that were in each state (Up, Down, Warning, Maintenance, Disabled, or Unknown) over the defined time period.
- State Change. Displays the state changes that the selected component underwent during the defined time period. This report is used for components that directly return their state when polled.
- Polled Values. Displays polled values from components that return values when polled. APM applies thresholds to these values to determine the states which are shown as state change markers.
- Instance Summary. Displays availability information about the instances associated with all applications, a specific application type or profile for the defined time period.
- Component Information. Displays current state, availability information for the defined time period, last polled value and threshold information used to determine the Warning and Down state for the selected component when APM manages the component's state based on values evaluated by thresholds defined in APM.
- State Change Log. Displays a chronological log of the changes in state for the instances in the selected application or profile, or the state of the components if a profile is selected, or the selected component.
- Action Log. Displays a chronological log of all actions that were fired within the defined time period.
- Resolved Actions Log. Displays a chronological log of the Action Policies that were acknowledged in the Running Action Policies report during the defined time period for all instances or components in the selected application, or profile; or for the selected component, when a single component is selected.
The following table describes which reports are available in the Historical Status section based on the scope selected in the application tree:
|
Hourly Availability |
State Change |
Instance Summary |
Component Summary |
Component Information |
State Change Log |
Action Log |
Resolved Items Log |
All Applications |
YES |
NO |
YES |
NO |
NO |
YES |
YES |
YES |
Application Type |
YES |
NO |
YES |
NO |
NO |
YES |
YES |
YES |
Profile |
YES |
NO |
YES |
NO |
NO |
YES |
YES |
YES |
Instance |
YES |
NO |
NO |
YES |
NO |
YES |
YES |
YES |
Component |
NO |
YES |
NO |
NO |
YES |
YES |
YES |
YES |
To set the date and time range:
- Set the Start date.
- Click the calendar icon
 . The calendar appears.
 - Choose the start date. The date appears in the Start Date box.
- Click the calendar icon
- Set the Start time.
- Click the watch icon
 . The time list appears.
 - Select the start time. The time appears in the Start Date box.
- Click the watch icon
- Set the End date.
- Click the calendar icon . The calendar appears.
- Choose the end date. The date appears in the End Date box.
- Click the calendar icon
- Set the End time.
- Click the watch icon . The time list appears.
- Select the end time. The time appears in the End Date box.
- Click the watch icon
- Click Apply. The actions for the selected time range are loaded into the Action Log.