Understanding Flow Monitor dashboard reports
Dashboard reports are the individual small reports displayed in several of the Flow Monitor reports and their views. Flow Monitor report views are user-customizable; they let you organize various dashboard reports by the type of information they display.
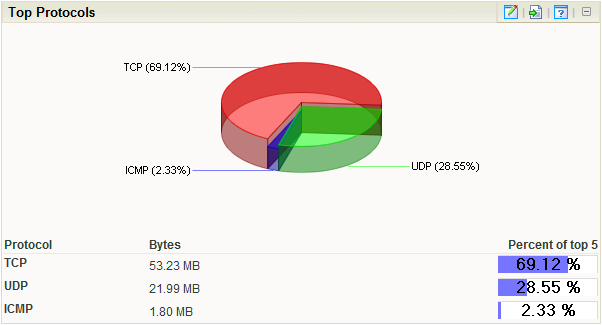
Flow Monitor dashboard reports typically consist of a graph and a table of data related to the graph.
Dashboard reports that display data from Flow Monitor can be used within Flow Monitor report views and WhatsUp Gold dashboard views.
Note: While you can determine which dashboard reports appear in dashboard views in Flow Monitor and WhatsUp Gold, Flow Monitor report views are more structured than WhatsUp Gold dashboard views. In WhatsUp Gold, you can position dashboard reports anywhere within a view; in Flow Monitor, report positions cannot be modified. As a rule, sender dashboard reports display on the left side of the report, while receiver dashboard reports display on the right side. Further, a page with no sender or receiver reports displays dashboard reports in one column.