About the NBAR and CBQoS Reports
NBAR Report
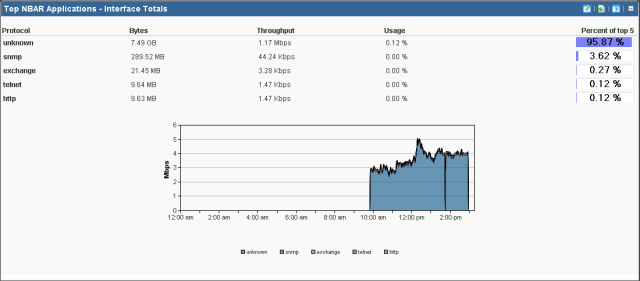
Cisco Systems Network Based Application Recognition (NBAR) classification engine provides a network device with the ability to recognize applications, including those that dynamically assign TCP or UDP ports. The Top NBAR Applications report displays the top applications as identified using Cisco's NBAR classification engine.
You can choose to display and sort sender traffic by bytes, packets, or flows using the Display and sort by option on the report configuration dialog. Providing alternate sorting methods allows you to monitor and identify hosts that are the largest consumers of interface resources other than bandwidth.
- Application. Displays the application as identified by Cisco's NBAR classification engine.
- You can select one of the following units to display and sort the specific items in the report using the Display and sort by option on the report configuration dialog. The selected option will appear as the first column header in the report and will be used to sort the top "n" items.
- Bytes. Displays the total number of bytes transmitted for the specific item in the report category for the selected date range.
- Packets. Displays the total number of packets for the specific item in the report category for the selected date range.
- Flows. Displays the total number of flows for the specific item in the report category for the selected date range.
- Rate. Displays the average bit rate, packet rate or flow rate, in multiples of the selected unit (e.g. Kbps, Mbps, or Gbps) for the specific item in the report category for the selected date range.
- Utilization. Displays the percentage of the total available bandwidth used by the specific item in the report category for the selected date range.
Note: Utilization is displayed as N/A if a speed is not specified for the interface, or if you have selected to display packets or flows in the report. If you are displaying bytes, you can set the interface speed on the Flow Interface dialog. To navigate to the Flow Interface dialog, click the Configure link in the message appearing above the dashboard reports.
- Percentage. Displays the percentage of the total traffic for the specific item in the report category for the selected date range.
- Others (row title). The optional Others row title displays a summation of all of the unspecified items of the report category. The unspecified items are those items not specifically displayed in the top "n" items. The Others row provides a comparison between the specified items, or top "n" items selected for display, and the rest of the traffic on the interface. When displayed, the Others row will provide perspective as to the relative size of the specified items in comparison to the total traffic on the interface.
- Totals (row title). Displays the total of all of the items in the report category, specified and unspecified (Others). This row shows the interface totals for each column in the report.
Note: The source device must be configured to generate NBAR information in order for this report to generate data for the source device.
Note: For the Top NBAR Applications - Flow Details report, NBAR information generated by the source device is gathered by Flow Monitor from flow data using Flexible NetFlow.
Note: For the Top NBAR Applications - Interface Totals report, the NBAR information is gathered from the source device using SNMP polling. The Poll source for NBAR information option is available on the Flow Source dialog.
Class Based Quality of Service Report
The Class Based Quality of Service (CBQoS) report provides information about the effectiveness of class-based policies applied to an interface for all of the defined classes.
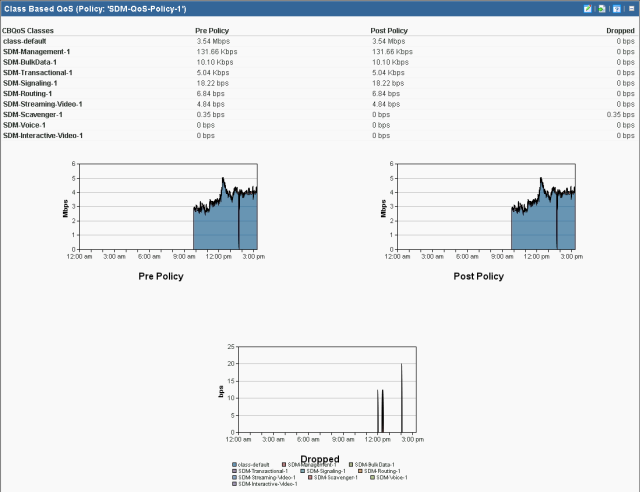
- QoS Class Map. Displays the QoS class name as defined by the policy assigned to the interface.
- Pre-Policy. Displays the amount of traffic for the class before the policy is applied.
- Post-Policy. Displays the amount of traffic for the class after the policy is applied.
- Dropped. Displays the number of bytes dropped as a result of applying the policy to the class.
Note: You must have defined QoS classes and policies on the source device before this report is able to display results.
Note: The CBQoS information generated by the source device must be gathered using SNMP polling for CBQoS information.