Interface Discards
This network monitor report displays the percentage of interface utilization discards for inbound and outbound packet data for a device interface, or group of device interfaces, during a selected time period. This report allows you to monitor and troubleshoot interfaces experiencing packet discard problems.
- Configure the data collection for a device by right-clicking the device in the Device list and selecting Properties > Performance Monitors, then selecting Interface Utilization > Configure.
Note: To ensure that your data collection is uninterrupted in the occurrence of a re-index, click Advanced and change the Determine uniqueness by list option to Interface description.
- Configure the data collection for a group by right-clicking a group from the Device list, selecting Bulk Field Change > Performance Monitors, and then making a selection from the Interface menu.
Device report: |
Group report: |
|
|
Monitor report body for device reports
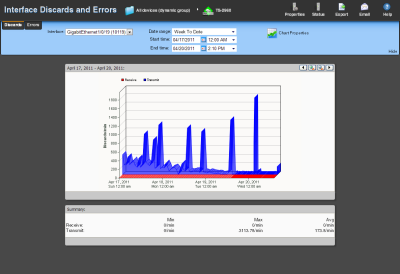
Below the date/time picker is a graph showing interface utilization for the selected time period. Each point on the graph corresponds with an entry in the graph data table below. ifInDiscards (Receive) are graphed as a red line, while ifOutDiscards (Transmit) are graphed as a blue line.When multiple interfaces are present in the selected device, change the selected interface using the Interface menu.
Summary
Under the main report graph, the report displays a summary of data for the interface collected during the time period:
Receive
- Min. The minimum number of interface discard packets received (ifInDiscards) per minute.
- Max. The maximum number of interface discard packets received (ifInDiscards) per minute.
- Avg. The average number of interface discard packets received (ifInDiscards) per minute.
Transmit
- Min. The minimum number of interface discard packets transmitted (ifOutDiscards) per minute.
- Max. The maximum number of interface discard packets transmitted (ifOutDiscards) per minute.
- Avg. The average number of interface discard packets transmitted (ifOutDiscards) per minute.
Note: Values displayed in the graph are the average values for the selected time period. Values displayed in the summary are the minimum, maximum, and average values for the selected time period. If raw polling data has been averaged into hourly or daily summarized data, the values for min and average, or maximum and average can be different. In some cases, they may be very different if there was a period of time when polled values were much higher or lower than normal.
You can verify your report rollup settings on the WhatsUp Gold console via Program Options > Report Data.
Changing how the chart looks
Click the Chart Properties button to change how the report chart is displayed.
Monitor report body for groups
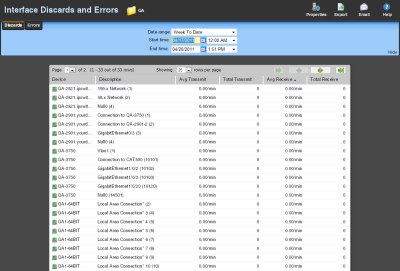
Below the date/time picker is a table showing device interface packet discard information for the selected time period:
- Device. The network device name.
- Description. The network device interface decription.
- Avg Transmit. The avergage number of discarded packets transmitted from each interface per minute.
- Total Transmit. The total number of discarded packets transmitted for each interface.
- Receive. The average number of discarded packets received from each interface per minute.
- Total Receive. The total number of discarded packets received for each interface.
Navigation
- Change the device you are viewing by clicking the group or device name currently in context and then selecting a new device in the device picker.
- Change to another device monitor report by selecting a different report button.
Viewing Properties
- To view the properties of the current group or device, click Properties in the toolbar.

