Flow Monitor Home
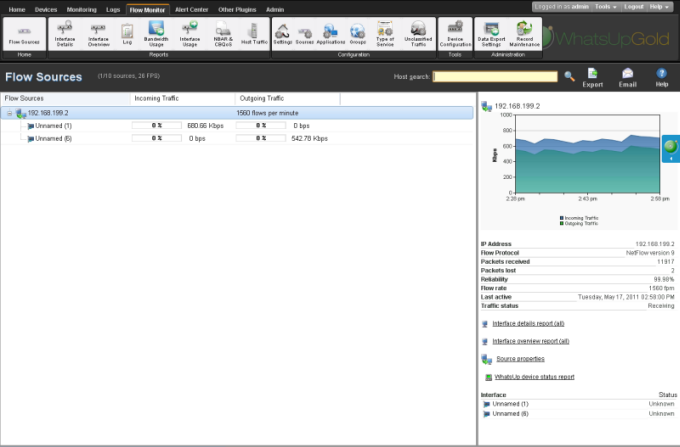
The Flow Monitor Flow Sources page provides a summary of the current usage and status of Flow Monitor sources, and acts as the Home page for the Flow Monitor plug-in. The left and right panes of the content pane display different types of data; Flow Sources on the left and Source and Interface Details on the right. Click Flow Monitor > Flow Sources to open the Flow Monitor Flow Sources screen.
Flow Monitor sources
The left pane of the page lists each of the monitored sources and the interfaces associated with each source.
In the Flow Sources title bar, the number of licensed sources and total licenses available is displayed along with the total number of flows per second received by all of the licensed sources. For example, the following (2/10 sources, 65 FPS) indicates that there are 2 licensed sources of 10 available licenses, and that the total flows per second being received by all of the sources is 65 flows per second.
- Flow Sources. Routers and switches that have been configured to send flow data to Flow Monitor and are enabled in Flow Monitor are listed in this column. In the list, sources are organized at the top level. Associated interfaces for each source are below the source name. Use the
 collapse and
  expand buttons to show or hide source interfaces. For each source, the number of flows per minute (fpm) for Flow devices and samples per minute (spm) for sFlow devices generated by all interfaces on the selected source over the the last period is displayed. When you select a source from the Flow Sources list, its total traffic is displayed in the right pane, along with all of the other information about the source.
Note: Interfaces can be hidden; if you do not see an interface listed on this dashboard report, check to see if it has been hidden via the Flow Interface dialog.
Tip: If you do not see a source listed that you would like to monitor, first go to the Flow Sources dialog to configure source settings. If you still do not see the router listed, check to see that the router is configured to send flow data. For more information, see Configuring Flow Monitor sources or Configuring sFlow sources.
- SNMP Sources. SNMP Sources are Flow Sources that have been created for the purpose of collecting NBAR and CBQoS statistics from a device using SNMP polling instead of flow data. SNMP Sources appear as normal Flow Sources. For information on creating an SNMP source, see Create Flow Source.
- Aggregate Sources. Aggregate Sources are individual interfaces existing on one or many Flow Sources that are aggregated into a single logical group that is treated as a separate source for reporting purposes. These sources appear as folders below the Flow Sources. For information on creating an Aggregate Source, see Creating an Aggregate Source.
- Incoming Interface Traffic. Incoming traffic is reported as a percentage of usage according to the interface's speed, and number of incoming bytes per second (bps) based on the last traffic to enter the interface.
- Outgoing Interface Traffic. Outgoing traffic is reported as a percentage of usage according to the interface's speed, and as the number of outgoing bytes per second (bps) based on the last traffic to leave the interface.
Source and interface details
The right side of the page gives detailed information about a selected source or interface.
Note: If you have not enabled Flow sources at this time, a Welcome dashboard report is displayed on the right side of the Flow Monitor Home page. Consult this dashboard report for information on configuring your routers to send Flow data, and for other general Flow Monitor configuration information.
Source details
Click a source, or device in the list to view the Source details on the right side of the Home page.
- IP address. The source router's IP address.
- Flow protocol. The version of Flow or sFlow the source uses when exporting flow data.
- Sample rate. The rate at which the source is polling interface data.
Note: The sample rate appears for only for sources sending sampled NetFlow data.
- Packets received. The number of packets the collector received from the source since the collector service was started.
- Packets lost. The number of packets sent from the source but not received by the collector since the collector service was started.
- Reliability. The percentage of packets received versus packets lost by the source since the collector service was started.
- Flow rate. The number of flows per minute (fpm) reported by the source during the last collection interval.
- Last active. The last time traffic was received from the source.
- Traffic status. Whether Flow Monitor is receiving traffic from the source; either receiving, or not receiving.
Note: If any traffic has been received within the last 30 minutes, the traffic status is displayed as receiving.
Use the Source Properties link at the bottom of the source details to view the Flow Source dialog and use the Interface links to view the WhatsUp Gold Interface Details report.
Note: A link for the WhatsUp Gold Interface Details report appears only if the source is monitored in WhatsUp Gold.
Interface details
Click a source device interface in the list to view the Interface details on the right side of the Home page. The Interface Traffic report for the last collection interval is displayed at the top of the interface's details.
- Last incoming details. The last time traffic transmitted over the incoming interface.
- Last outgoing details. The last time traffic transmitted over the outgoing interface.
- Interface type. The type of the interface; for example, Ethernet CSMA/CD.
- In speed. The speed at which data is flowing to the interface.
- Out speed. The speed at which data is flowing from the interface.
- Status. The status of the interface; either Up, Down, or Unknown.
Use the links at the bottom of the interface details to view the Interface Details and Interface Overview reports, as well as the Flow Interface Properties.
Exporting, emailing, scheduling and managing reports
Use the Export ![]() icon, at the top right of the page, to export reports. Use the Email
icon, at the top right of the page, to export reports. Use the Email ![]() icon to E-mail a report or to manage Scheduled Reports. For more information see, Using Scheduled Reports in Flow Monitor: printing, exporting, and emailing reports.
icon to E-mail a report or to manage Scheduled Reports. For more information see, Using Scheduled Reports in Flow Monitor: printing, exporting, and emailing reports.
Host Search
Use the Host Search tool in the upper-right side of the page to locate traffic to or from a host or group of hosts.
To perform a host search:
- Enter search criteria, such as an IP address or host name, in the Host search field.
- Click the search button
 .
. - When a host name is entered for search, the Host Search dialog appears with a list of interfaces where traffic to that host has been logged. You can use the search options in the Host Search dialog to further narrow your search. For more information, see the Flow Monitor Host Search dialog help.
- When a complete IP address is entered for search, the Select Interface dialog appears with a list of interfaces where traffic to that IP has been logged.
Note: The Domain, Country, and Last Resolved fields may show as Not Available if the IP address is not available in the DNS.
Tip: Use the right-click menu on this page to view and configure parts of the application. For more information, see Using the Flow Home page right-click menu.