Viewing Real-time Data in Full Reports
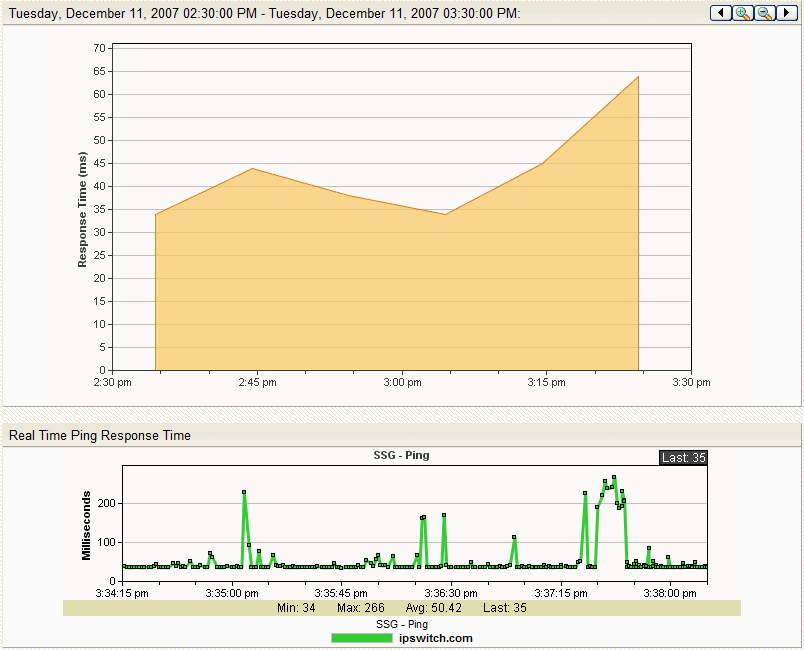
For all full reports where real-time data is available, a second graph is available below the graph showing historical data. This second graph displays poll data for the report in real-time, updating every second.
By default, the real-time graph is collapsed. To view the graph, click the plus sign.
