Filtering by keywords
You can use keyword filters to create complex Flow Monitor interface report views. This is useful when you need to view data about the traffic generated by a specific computer, to a specific domain, etc.
After you apply a filter to the Interface Details report, the workspace report that coincides with the filter reloads with a time graph for the filtered traffic component. For example, if you apply a filter for the http application, the Top Applications workspace report displays a time graph of http application use for the time period selected at the top of the Interface Details report.
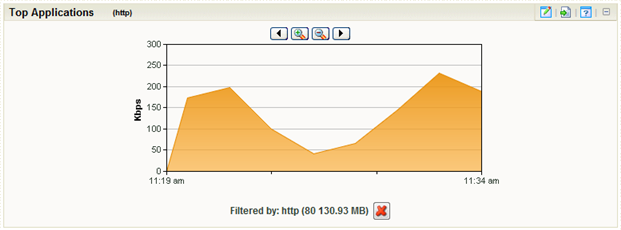
You can easily determine which workspace report contains the time graph by looking for the filter enclosed in parenthesis to the right of the workspace report title name.
Tip: You can remove the applied filter by clicking the red X under the time graph.
To filter by keywords:
- At the top of the report, select Add Filter. Filter fields appear below the button.
- Select the type of filter you want to apply.
- Sender. Show traffic sent by the specified device. You can match a device using its host name or its IP address.
- Receiver. Show traffic received by the specified device. You can match a device using its host name or its IP address.
- Protocol. Show traffic that used the specified protocol (such as UDP, TCP, or ICMP).
- Service. Show traffic that used the specified type of service.
- Application. Show traffic that used the specified application. The keyword must match the application name as configured in the Flow ports dialog.
Tip: You can enter a port number instead of an application name to show all traffic transmitting over a certain port.
- Sender Domain. Show traffic sent by hosts on the specified domain.
- Receiver Domain. Show traffic received by hosts on the specified domain.
- Sender Country. Show traffic sent by devices whose IP addresses are registered to the specified country.
- Receiver Country. Show traffic received by devices whose IP addresses are registered to the specified country.
- Sender Group. Show traffic sent by the specified group.
- Receiver Group. Show traffic received by the specified group.
- Sender TLD. Show traffic sent by domains that have the specified top level domain (such as .com, .net, .us, or .uk).
- Receiver TLD. Show traffic received by domains that have the specified top level domain (such as .com, .net, .us, or .uk).
- ICMP Type. Show traffic by ICMP type.
- Packet Size. Show traffic by packet size.
- Optionally, click Add Filter to add additional filters.
- Click Apply Filters. The report refreshes showing only data that matches the filters you have configured.
Tip: If you configure a filter incorrectly, you can remove it from the current view by clicking the red X located to the right of the keyword field.