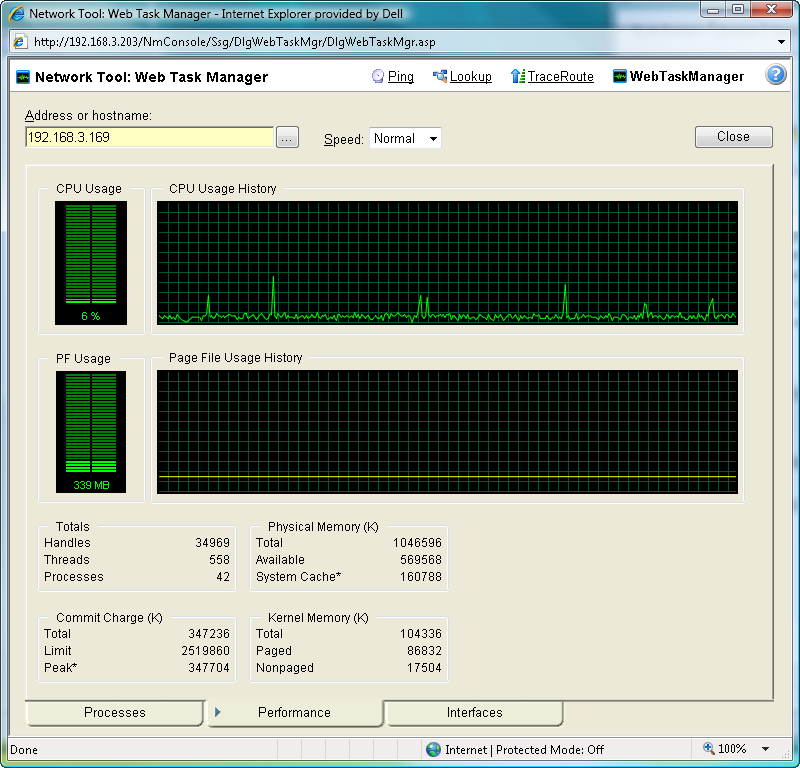
Using the Web Task Manager - Performance tab
The Performance tab provides dynamic performance information for a selected device that WhatsUp Gold is monitoring. This information helps you learn about device performance and identify trends, spikes, or other issues that occur on a particular network device. You can use the Web Task Manager to view device performance for devices that are WMI or SNMP enabled network devices.

After you have identified a performance issue that is causing device performance issues, such as the Page File Usage indicating that the system memory is nearly at full capacity, you can correct the problem to bring the device performance back to normal.
Note: When viewing information for devices running Microsoft Windows, information gathered via WMI is displayed in real time. Information gathered by SNMP, however, may reflect a delay of one minute or more. This delay is caused by a limitation in how often Microsoft Windows updates SNMP values.
To use the Web Task Manager:
- Open the Web Task Manager.
- From the web interface, click GO. The GO menu appears.
- If the WhatsUp section is not visible, click WhatsUp. The WhatsUp section of the GO menu appears.
- Select Tools > Web Task Manager. The Web Task Manager appears.
- Enter or select the appropriate information for the following fields:
- Address or hostname. Enter a device IP address to select a device for which you want to view process information. Click Reconnect to connect with a device that has disconnected from the Web Task Manager.
- Browse (...). Click to open the Web Task Manager Credentials dialog and set a WMI user name and password or an SNMP read community. The credential options are provided from the credentials stored in the Credentials Library.
- Speed. Select the speed at which you want to monitor the device performance.
- Normal. Updates device information every one second.
- Medium. Updates device information every five seconds.
- Slow. Updates device information every ten seconds.
- Paused. Stops updating device information.
- Connect using. Select the device protocol (WMI or SNMP) used to monitor and manage the device. The credentials stored in the Credentials Library are used to connect and read information on the selected device.
Note: When viewing information for devices running Microsoft Windows, information gathered by SNMP may reflect a delay of one minute or more. This delay is caused by a limitation in how often Microsoft Windows updates SNMP values. For this reason, we recommend using a Speed of Medium or Slow when using SNMP to view interface information about a device running Microsoft Windows.
- At the bottom of the Task Manager page, select the tab that you want to use (Processes, Performance, or Interfaces).
- For troubleshooting information, see Troubleshooting SNMP and WMI connections.
The following are examples of information that is provided when you connect to and view a WMI enabled device. Note, this information varies by operating system:
- CPU Usage. This graph indicates the percentage of time the processor is operating. Use this graph to view how much the processor is operating.
- CPU Usage History. This graph indicates how much the processor has operated over time. You can change the Speed option (High, Normal, Slow, Paused). The Speed option determines how often updates occur to the CPU Usage History.
- PF Usage. This graph indicates how much page file memory is used.
- Page File Usage History. This graph indicates how much the page file memory is used over time. If page file memory usage is high, you may want to increase the available page file memory.
- Totals. This provides the total number of Handles, Threads, and Processes occurring on the selected device.
- Commit Charge (K). Provides information about the memory (Total, Limit, and Peak) allocated to the operating system and applications running on the device.
- Physical Memory (K). Provides information about the amount of physical memory (Total, Available, and System Cache) installed on the device.
- Kernel Memory (K). Provides information about how much memory (Total, Paged, and Nonpaged) the operating system kernel and device drivers are using.
Note: Values reported for Peak and System Cache will differ from values reported by the Windows Task Manager on the actual device. In the Web Task Manager, Peak reflects the peak value for the time that the Web Task Manager has been open only, and System Cache does not include the size of the free page list.
The following information are examples of the information that is provided when you connect to and view a SNMP enabled device. Note, this information varies by operating system:
- In (PKTS). Provides detailed information about the network packets that this device receives.
- Out (PKTS). Provides detailed information about the network packets that this device sends.
- System. Provides general system information about CPU performance, the number of interfaces that are running on the device, the total amount of time the device has been operating in the up mode, and the version number of Cisco software running on the device (if applicable).
For troubleshooting information, see Troubleshooting SNMP and WMI connections.
 How to get here