About the VoIP custom performance monitor reports
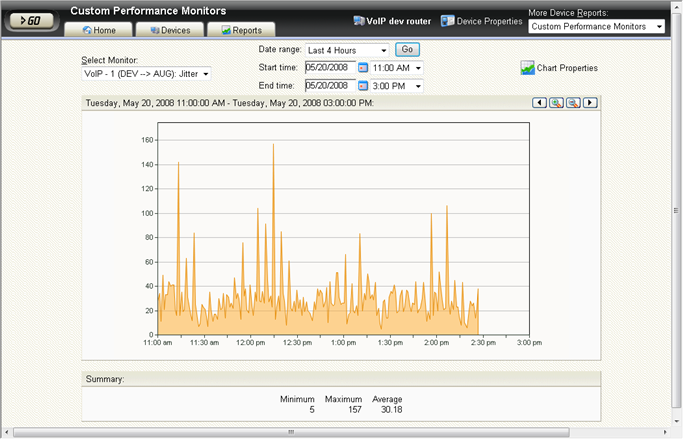
In addition to the VoIP workspace reports, more detailed custom performance monitor values are graphed over a selected period of time for each VoIP monitor.
To view the VoIP custom performance monitor reports:
- Mouse-over a specific VoIP workspace report graph, then click it. The related custom performance monitor report appears.
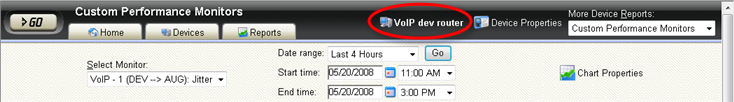
- or - - Click the Reports tab, click Custom Performance Monitors, then select the VoIP device in the application bar at the top of the page. To change the VoIP monitor type, select a new monitor in the Select Monitor list.
You can use the Date range and Start time/End time options to select the dates and times for which you want to view the VoIP performance data. At the bottom of the graph, the report displays a summary of monitor percentages collected during the time period:
- Minimum. The minimum monitor percentage experienced.
- Maximum. The maximum percentage experienced.
- Average. The average monitor percentage across all sample data for this period.
You can also change the chart properties; export data to a text file, Excel spreadsheet, or PDF. See the WhatsUp Gold Help for more information about using Custom Performance Monitors.