Configuring a WhatsUp Health threshold
To configure a WhatsUp Health threshold:
- Go to the Alert Center Home page:
- From the web interface, click GO. The GO menu appears.
- If the WhatsUp section is not visible, click WhatsUp. The WhatsUp section of the GO menu appears.
- Select Alert Center. The Alert Center Home page appears.
- Click Manage Thresholds. The Alert Center Threshold Library appears.
- Click New. The Select Threshold Type dialog appears.
- Select WhatsUp Health, then click OK. The New/Edit WhatsUp Health Threshold dialog appears.
- Enter a Name for the threshold; this name is displayed as the threshold's workspace report title on the Alert Center Home page.
- Select a tab to specify the appropriate category-specific threshold information.
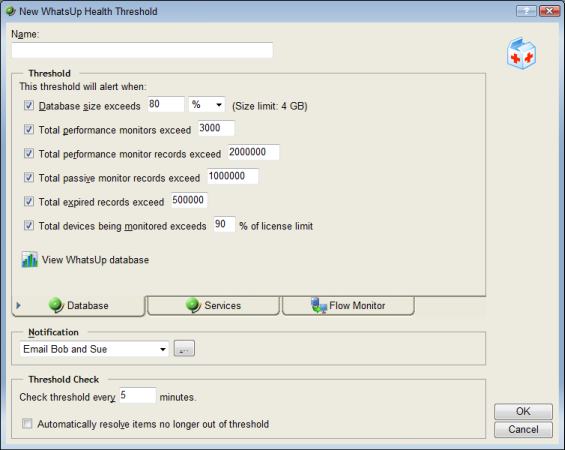
The Database tab contains threshold options pertaining to the WhatsUp Gold database.
- Database size exceeds ___ %/GB/MB. Select this option to have the threshold alert when the database size exceeds the value you specify. The default threshold value is 80%.
Note: If you have an unlimited-size database, WhatsUp Gold uses a 4GB cap to calculate the size of your database.
- Total performance monitors exceed ____. Select this option to have the threshold alert when the total number of performance monitors exceeds the number you specify. The default number of total performance monitors is 3,000.
- Total performance monitor records exceed ____. Select this option to have the threshold alert when the total number of performance monitor records exceeds the number you specify. The default number of total performance monitor records is 2,000,000.
- Total passive monitor records exceed ____. Select this option to have the threshold alert when the total number of passive monitor records exceeds the number you specify. The default number of total passive monitor records is 1,000,000.
- Total expired records exceed ____. Select this option to have the threshold alert when the total number of expired records exceeds the number you specify. The default number of total expired records is 500,000.
- Total devices being monitored exceeds ____ % of license limit. Select this option to have the threshold alert when the total number of devices being monitored exceeds the percentage of the license limit you specify. The default percentage of the license limit is 90%.
Tip: Click View WhatsUp database usage to view a graph of the current WhatsUp database usage.
The Services tab contains threshold options pertaining to the WhatsUp Gold service and Web service.
- The WhatsUp polling service is down ____ minutes. Select this option to have the threshold alert when the WhatsUp service has been down for the number of minutes you specify. The default threshold value is 5 minutes.
- The WhatsUp polling service SQL queries exceed ____ ms on average. Select this option to have the threshold alert when SQL queries exceed the number of ms on average that you specify. The default number is 750 ms.
- WhatsUp web service is down ____ minutes. Select this option to have the threshold alert when the web service is down for the number of minutes you specify. The default number is 5 minutes.
- WhatsUp web service HTTP responses exceed ____ ms on average. Select this option to have the threshold alert when HTTP responses from the web service exceed the number of ms on average you specify. The default number is 1,000 ms on average.
- WhatsUp web service SQL queries exceed ____ ms on average. Select this option to have the threshold alert when web service SQL queries exceed the number of ms on average that you specify. The default number is 750 ms on average.
- WhatsUp discovery service is down ____ minutes. Select this option to have the threshold alert when the WhatsUp discovery service is down the number of minutes that you specify. The default number is 5 minutes.
Note: Web service threshold checks do not apply to users running IIS.
Note: If you are experiencing a high volume of errors from your WhatsUp Health threshold service checks, please see Troubleshooting the WhatsUp Health Threshold.
The Flow Monitor tab contains threshold options pertaining to the WhatsUp Gold Flow Monitor.
- Netflow database size exceeds ____ %/GB/MB. Select this option to have the threshold alert when the Netflow database exceeds the value you specify. The default threshold value is 80%.
Note: If you have an unlimited-size database, WhatsUp Gold uses a 4GB cap to calculate the size of your database.
- NfArchive database size exceeds ____ %/GB/MB. Select this option to have the threshold alert when the NfArchive database size exceeds the value you specify. The default threshold value is 80%.
Note: If you have an unlimited-size database, WhatsUp Gold uses a 4GB cap to calculate the size of your database.
- The Flow collector service is down ____ minutes. Select this option to have the threshold alert when the Flow collector service is down for the number of minutes you specify. The default threshold value is 5 minutes.
- Any bounce traffic occurs. Select this option to have the threshold alert when bounce traffic occurs on a Flow Monitor source.
- Host records exceed ____. Select this option to have the threshold alert when the number of host records exceeds the amount you specify. The default threshold value is 2,000,000 records.
- Raw data records exceed ____. Select this option to have the threshold alert when the number of raw data records exceeds the amount you specify. The default threshold value is 1,000,000 records.
- Total sources sending data exceeds ____ % of license limit. Select this option to have the threshold alert when the total sources sending data exceeds the percentage of license limit that you specify. The default threshold value is 90% of license limit.
Tip: Click View Netflow database usage to view a graph of the current Netflow database usage. Click View NfArchive database usage to view a graph of the current NfArchive database usage.
- After selecting the desired options for each tab and entering the appropriate threshold variables and values, specify your choices for the Notification and Polling sections of the dialog.
Notification
Select the notification policy you would like to apply to this threshold. This policy kicks off when an item falls out of the threshold you configure above. If you do not see an appropriate threshold policy, or if the list is empty, browse (...) to the Notification Policy dialog to configure a new policy.
Note: It is not required that you select a notification policy for use with every threshold. If you do not select a notification policy, while no notifications will generate for the threshold, a workspace report with the out of threshold items will still appear on the Alert Center Home page, and out of threshold items will be listed on the Items Report.
Polling
Enter a value for the polling interval, or the interval at which the Alert Center checks the WhatsUp Gold database to see if there are items out of the threshold's parameters. The default polling interval is 3 minutes.
Note: We advise that your polling interval be shorter than the amount of time for which you are gathering data for this threshold. For example, if you configure a threshold that checks CPU data every 10 minutes, your polling interval should be 9 minutes or less. If the polling interval is longer than the data sample period, the Alert Center may miss data relevant to the threshold.
- Click OK to save changes.