Using link lines
Link lines are used to graphically illustrate the network link, or Interface service, between two devices. Link lines can also show the status of device services via associated active monitors.
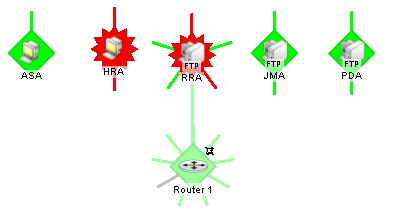
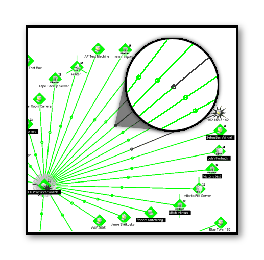
The following example shows a map with link lines displayed.
There are three ways to set up the connecting link lines:
- Manually, in Map View select a device, then right-click. On the right-click menu, select Link > Link to. (Select Link > Disconnect link to remove the link between devices.)
- Select a monitor for which you want to display a link line, then click OK. The link line cursor appears.
- Drag the cursor to another device and click to create a link.
- Automatically, during device discovery when using SNMP SmartScan. (On the console, select File > Discover Devices > SNMP SmartScan.)
Note: The Interface service must be included in the scan.
- Automatically, when you right-click a device, then select Properties > Active Monitors > Discover.
Note: When you use one of the automatic discover options, particularly when discovering interfaces on a router or switch, you need to enter the SNMP community string in the appropriate scan dialog. This lets the scan identify all the interfaces on the device.
If scanning a specific device (from the Device Properties > Active Monitors dialog), with the device selected, right-click and select Properties, then select Credentials. From SNMP v1/v2/v3 credentials, select Public. Click Active Monitors, then click Discover.
When you create links manually, the links are always connected links.
Both connect and disconnect skips the dialog if there is only one active monitor on the device, because it assumes you meant the existing monitor.
In the graphic above, there are two link lines connected by a dot in the center of the line between the two devices. This shows that the devices are linked both directions. This is done by repeating the process above from the second device, back to the first. Now, when one of the links goes down, you can see on which side the problem occurs.