Network Traffic Analysis Dashboards
Network Traffic Analysis Dashboards dashboard enables you to view, analyze, and share observed traffic patterns as well as current and historic network performance data by way of both built-in and custom dashboards.
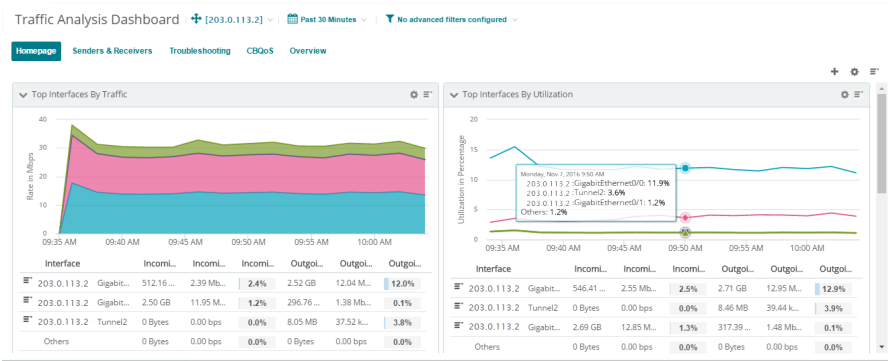
The Traffic Analysis dashboard provides three operational views, each with its own suite of reports, charting, graphing along with endpoint, application, and keyword filtering.
- Home. Top n traffic, connections, and bandwidth utilization reports at a glance.
- Senders and Receivers. Top n interfaces ranked by incoming and outgoing traffic, geo location, and Internet domain.
- Troubleshooting. Top concurrent connections received/initiated, half-open or failed connections received/initiated, and traffic hitting non-standard ports.
Note: You can add custom views with the Add View control (![]() ) and custom and built-in reports using the Add Reports palette.
) and custom and built-in reports using the Add Reports palette.
Traffic data metrics are collected from any network devices that support flow export (referred to in WhatsUp Gold as "flow sources"). Each flow source Network Traffic Analysis collects from provides a key observation point for gauging proper function and performance of critical network segments, services, and application infrastructure. You manage flow source configuration and collection status from the NTA Sources Library.
Tip: If you are using Network Traffic Analysis for the first time, walk through the steps in the NTA Quick Start to find active or ready-to configure flow sources already on your network.