Threshold Summary
Threshold Summary report reveals the unresolved item count for each threshold type and provides drill down into device monitoring details.
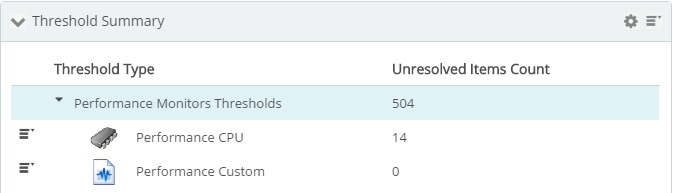
- . Thresholds are grouped by type; Network Traffic Analyzer, Passive Monitor, Performance Monitor, System, and Wireless. Specific thresholds are listed under each threshold type.
- . Displays the number of unresolved items for each threshold.
Generate a report
.  Sort and remove columns, group rows based on specific column values, remove and remove noise and chaff from the table.
Filter and pick by column
Click a report heading  and use the following from the drop down list:
Control
|
Purpose
|
Sort. 
|
Sort column in ascending or descending order.
|
Columns. 
|
Pick the columns you want to view. Click a check box to display the column. Clear the check box to hide it.
|
Group by this field.
|
Group table into collapsible rows wherever the current column contains identical data ("field") values.
|
Filters.
|
Provide a keyword to view only rows that contain the keyword for this column.
|
. Edit report name using the dialog.
Share, export, and save as PDF
Most generated Threshold Summary report data can be printed, shared, and exported when selecting ( ) from the Dashboard Options (
 ) menu. After the report has been expanded, select export (
 ) to access the following options:
 Filter and reduce by row and by column.