Dashboards![]() Traffic Analysis
Traffic Analysis![]() Traffic Overview
Traffic Overview
Dashboards![]() Traffic Analysis
Traffic Analysis![]() Traffic Overview
Traffic Overview
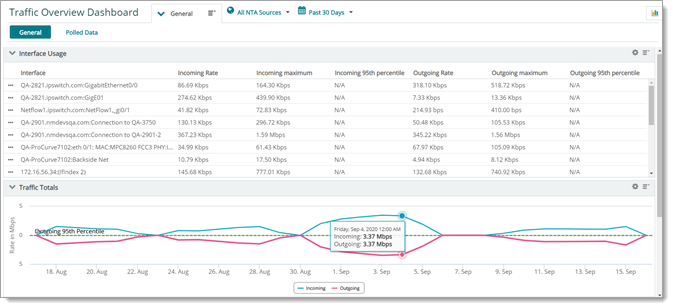
Traffic Overview provides aggregate totals of your NTA-monitored traffic. It contains traffic totals compiled from flow source devices together with traffic totals reported from polled interfaces. It does not contain detailed flow summary information. To view, analyze, and filter through detailed flow data, see the Traffic Analysis Dashboard.
Note: For NTA dashboard coverage that provides deep analysis of flow summary data (not polled traffic data), see the Network Traffic Analyzer Dashboard. From the Network Traffic Analyzer Dashboard, you can pivot through source data, apply Advanced Filters, and more.
It includes:
General |
Polled Data |
|
See Add NBAR Source for more information. |
Tip: By default, this dashboard displays traffic observed for the last 30 days. Retaining more flow data betters your ability to spot trends (daily, weekly, monthly) in your network's traffic.
Note: You can add custom views with the Add View control (![]() ) and custom and built-in reports using the Add Reports pallet.
) and custom and built-in reports using the Add Reports pallet.