AWS CloudWatch (Performance)
The AWS CloudWatch Performance Monitor allows you to view the performance statistics Amazon collects about your network resources and to configure thresholds for specific metrics used to trigger alerts in the event the specified metric falls below or rises above a defined value.
- Configure the following fields to set up your AWS CloudWatch Performance Monitor:
- . Enter a unique name for the monitor. This name displays in the Performance Monitor Library.
- . Enter additional information for the monitor. This description displays next to the monitor name in the Performance Monitor Library.
- Click to begin selecting specific metrics to monitor.
- Select a valid from the list, then click .
- Select your .
- Select the , , and from the respective lists under Choose Metric. Please note, this is the step where you can configure the AWS CloudWatch Performance Monitor to track billing/estimated charges.
- Choose an instance set from the list of under Choose Instance. Individual instances in the specified set from which to select for monitoring appear below.
- Select an to monitor. Once loaded, you can click to preview available instance data.
- Click to return to the performance monitor configuration dialog.
- Click .
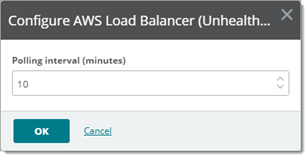
Polling Interval
After you configure and apply a AWS CloudWatch (Performance) monitor to a device, you can adjust its from Device Properties ( ).
).

![]() ).
).