Dashboards![]() Traffic Analysis
Traffic Analysis![]() Traffic Analysis Dashboard
Traffic Analysis Dashboard
Dashboards![]() Traffic Analysis
Traffic Analysis![]() Traffic Analysis Dashboard
Traffic Analysis Dashboard
Network Traffic Analyzer dashboards enable you to view, analyze, and share current and historic traffic and network performance patterns. This rich feature set enables you to leverage built-in and custom dashboards and NOC views, on demand or scheduled reports, report data export and scheduled report distribution (such as sending a daily report by way of email), advanced filtering, and much more.
Important: Report detail and precision (for NTA characteristics that are measurable) can depend on the NTA data collection interval and how long you choose to retain raw data. For more information, see the section titled Choosing the Right Level of Detail and check your data collection interval from the SETTINGS menu > Network Traffic Analysis > NTA Settings dialog.
Tip: If you are using Network Traffic Analyzer for the first time, check the topic titled Before You Begin to find active or ready-to configure flow sources already on your network.
|
|
|
|
|
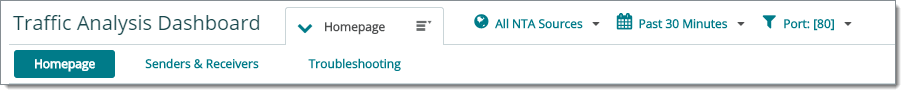
The Traffic Analysis dashboard provides three operational views, each with its own suite of reports, charting, graphing along with endpoint, application, and keyword filtering rule sets. Advanced filtering, time range, and grouping by IP address, location and more make NTA a very powerful decision support, forensic, and root cause analysis solution.
Note: You can add custom views with the Add View control (![]() ) and custom and built-in reports using the Add Reports palette.
) and custom and built-in reports using the Add Reports palette.
All the reports that can be included in this dashboard are initially column-sorted by traffic totals in bytes (default). You can select the field to sort on in Report Settings ![]() .
.
You can sort reports with respect to traffic totals by either of the following:
Tip: Having a large number of connections (flows) can be an indication of a security issue.
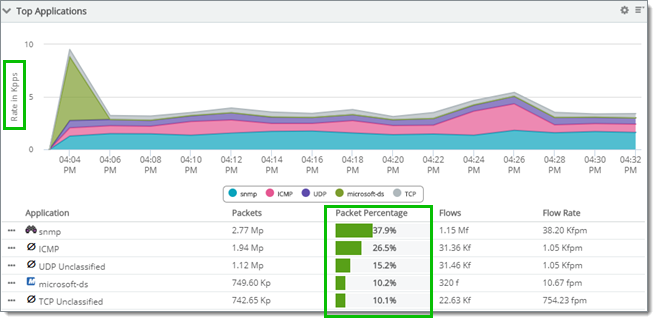
When changing the chart, reports automatically change the variable used for the units. When you adjust the 'sort by' column attribute, the rows sort in descending order according to the data values found in the sort by column. For example, the following table sorts by packets. ("Megapackets" is shown in the report included below.)
Top Applications Report with Packets Selected as the Sort by Field and Rate Shown in Kilopackets per Second
Tip: It is best practice to include the sort by field columns in the grid (packet rate or flow rate), otherwise, the grid might seem to be unsorted.
If you display NTA report data using a line graph, the level of detail revealed by the graph depends on how much raw or hourly data is retained according to NTA Settings. This characteristic applies to line graph reports that reveal either Flow, QoS, Interface or NBAR traffic data.
When you choose time constraints (![]() ) for a graphed NTA report, the granularity of time-interval detail revealed in the graph is determined by factors listed in the following table:
) for a graphed NTA report, the granularity of time-interval detail revealed in the graph is determined by factors listed in the following table:
Factor |
Description |
Raw, hourly, and daily data retention policies |
The graph always displays data in the highest resolution available in the NTA database (in other words raw or hourly). —Otherwise, the default resolution or archived data is displayed (daily). You can adjust these retention policies in NTA Settings. |
Period of time you request for the report (Past 30 Minutes, Today, Past N Days, ...) |
If the NTA database does not contain the full set of data for the period you request (for example, because of NTA retention policies or operating time), then the next level of resolution is displayed. You can select the period for the report within the report or dashboard view. |
Raw collection interval |
The NTA raw Data Collection Interval and raw data collection retention (when you need to scan for minute-by-minute changes). You can adjust the raw collection interval in NTA Settings. |