About the Web Performance Monitor
The Web Performance Monitor extends the functionality of the Microsoft Windows Performance Monitor to the Web. It is a data collecting and graphing utility designed specifically for the WhatsUp Gold Web interface that graphs and displays real-time information on user-specified SNMP and WMI performance counters. It can be used for a quick inspection of a specific network device.
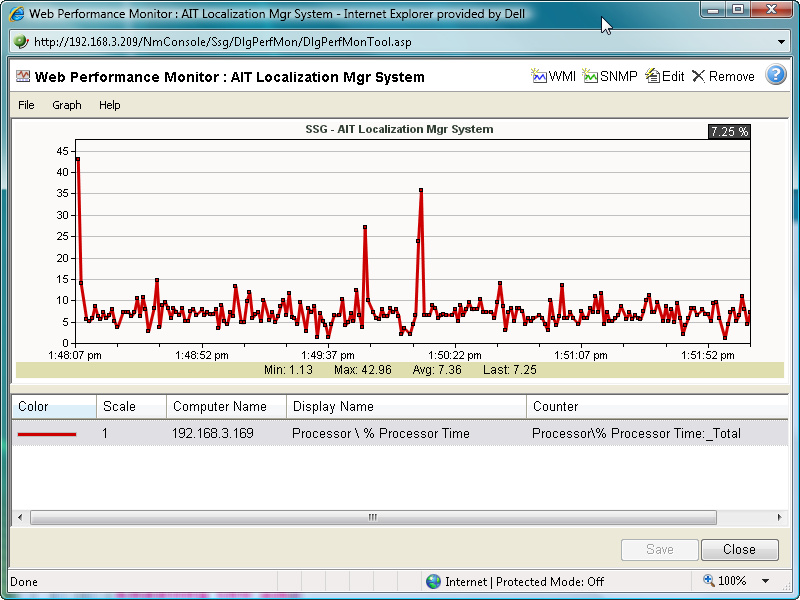
The graphs can be saved to the database and displayed on workspace views using the Split Second Graph - Performance Monitor workspace report or on the Web Performance Monitor tool. Multiple SNMP and WMI counters can be displayed on a single graph, and the color and scale of each graphed item can be individually configured.
Graphs created with the Web Performance Monitor are saved on a per-user account basis, meaning, graphs are only accessible by the user account that created and saved them.
The Web Performance Monitor has two purposes:
- To provide a Web enabled WMI and SNMP performance counter poller and grapher. It supports WMI for Windows servers, and SNMP for network devices such as switches, routers, and UNIX devices.
- To build and edit graphs for use by the Performance Monitor workspace report. You can use this workspace report to display any saved graph.
For more information, see Using the Web Performance Monitor.