Example: discovering devices
To discover devices:
- Select File > Discover Devices. The New Device Discovery Wizard appears.
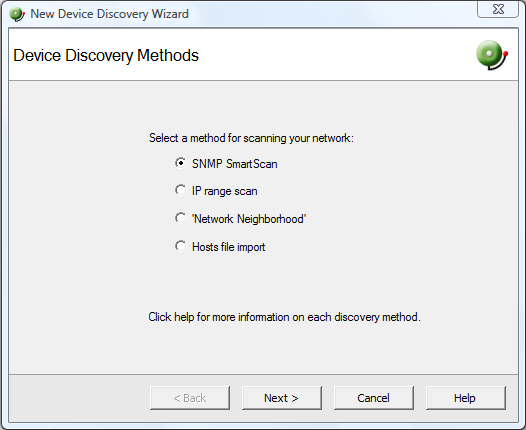
- Select SNMP SmartScan as the method for scanning your network, then click Next. The SNMP SmartScan settings dialog appears.
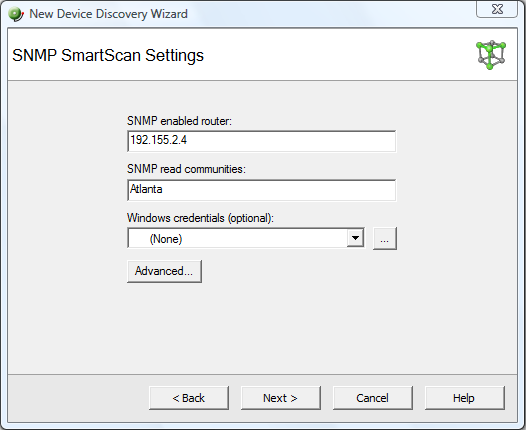
- In the SNMP enabled router box, enter the IP address of the SNMP enabled router you want to use for this scan.
- In the SNMP read communities box, enter the proper read community string for that router. If an incorrect string is entered, WhatsUp Gold will be unable to scan the network. Additional community strings may be entered, separated by commas, if there are multiple SNMP enabled devices on your network that use different strings.
Optionally, select the Windows credential that you want to use during discovery. These credentials are configured in the Credentials Library, and store Windows authentication information (username and password) for those devices that require a logon for discovery or monitoring. Click the browse (...) button next to this box to access the Credentials Library. You can select a specific credential, select All to try all credentials that are configured or select None to ignore those devices that require you to log on. The credential that is successful is associated with each device.
- Click the Advanced button if you want to change the scan's default timeouts in milliseconds, retry counts, and scan depth.
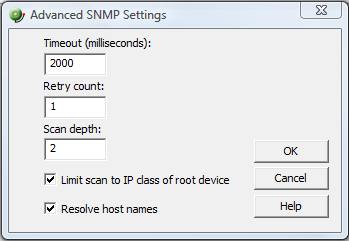
- Click to select the Limit scan to IP class of root device option if you want to limit the scan to the network class (A, B, or C) defined by the IP address of the root device. If the IP address is within the network class of the root device, the scan proceeds. Otherwise, the scan skips to the next IP address.
- Click to select the Resolve host names option if you want to populate the list of discovered devices with host names in addition to IP addresses.
- Click OK to save changes and return to the SNMP SmartScan settings dialog.
- Click Next. The Active/Performance Monitors to Scan dialog appears. Select the type of Active Monitor(s) and Performance Monitor(s) you want to use in this scan process. In this example, select DNS, HTTP, and Interface as our Active Monitors (Ping is selected by default) and CPU, Disk, and Interface Utilization as our Performance Monitors to be used in the scan process.
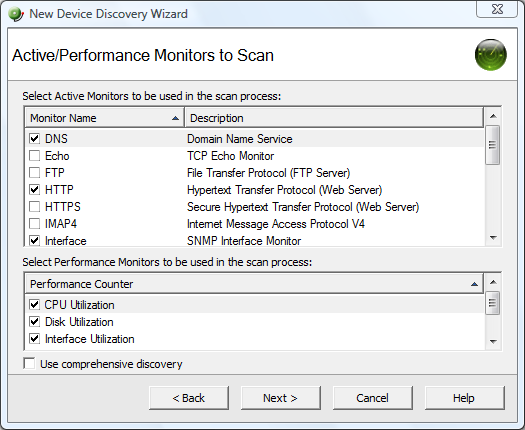
- The Ping monitor polls the device on a regular basis to establish whether it is Up or Down. By default, WhatsUp Gold sends a ping command to each viable IP address in the range configured during the first section of this wizard. If the device responds, WhatsUp Gold scans for the monitors listed on this dialog. If the device does not respond, discovery moves on to the next IP address. You can select Use comprehensive discovery to have device discovery scan each IP address for all of the selected monitors without first sending the ping command to the device. Discovery takes longer if this option is selected.
Note: If you want a Ping monitor created for the devices found in discovery, you must select Ping as an active monitor to scan even if you have cleared the Use comprehensive discovery option.
Note: If a device only has one interface, WhatsUp Gold intentionally does not add the Interface Active Monitor during discovery. Doing so with the Ping Active Monitor would be redundant.
- The HTTP monitor polls a web server (if one is discovered) on the device on a regular basis to establish if it is Up or Down.
Tip: To see how a monitor is configured, you can go to the Active Monitor Library (Configure > Active Monitors), select a monitor, then click Edit.
- The Disk Utilization monitor monitors and reports on the available disk space for the selected device. Data collected is displayed in the Disk Utilization Report.
- The Ping monitor polls the device on a regular basis to establish whether it is Up or Down. By default, WhatsUp Gold sends a ping command to each viable IP address in the range configured during the first section of this wizard. If the device responds, WhatsUp Gold scans for the monitors listed on this dialog. If the device does not respond, discovery moves on to the next IP address. You can select Use comprehensive discovery to have device discovery scan each IP address for all of the selected monitors without first sending the ping command to the device. Discovery takes longer if this option is selected.
- Click Next. The Device Discovery displays the estimated remaining scan time and the scan's progress. You can cancel the Device Discovery by clicking Stop.
- When the Discovery is completed, the Devices to Monitor window appears, listing all of the devices just discovered and the active and passive monitors that were applied. Note that if any of the devices have already been entered into the database, a shortcut to the device will be created in the device list. To add all of the devices to the database, click Next. To remove specific devices to be monitored from this list, clear the checkbox next to the device you want to remove.
Note: Additional Active Monitors and Performance Monitors that are already in the database will not be added to devices.
- Click Next. The Action Policy Selection dialog appears. For more information about Action Policies, see About Action Policies.
- Complete the remaining screens in the wizard.
The Results summary shows the number of selected new devices, number of active and performance monitors, whether or not an Action Policy is applied, and the number of selected device shortcuts.
- Click Finish to begin monitoring the devices. A progress bar appears while devices are added to the database, then the Device View appears with a list of new devices found in the device discovery process. For more information about Device Views, see About the Device View.
Note: If some device group folders are empty, it is due to the fact that although a subnet was found, the devices in the subnet were either not scannable, or you chose not to monitor them.