![]()
![]()
![]()
![]()
|
|
|
|
|
The dashboard at the top of the Monitor displays all Ipswitch Analytics Agents on your system. An Agent collects data from a MOVEit database and sends that data to Ipswitch Analytics.
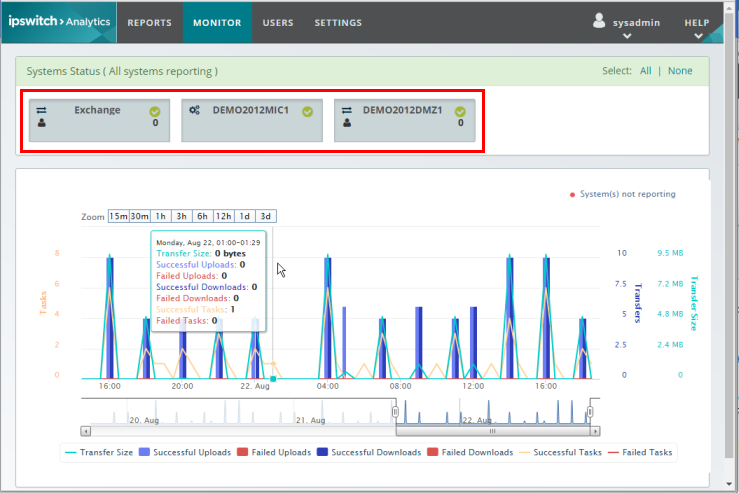
The dashboard shows a different colored System Status, depending on how many Agents are online currently:
|
All Agents are online and sending data to Ipswitch Analytics. |
|
Some Agents are online and sending data to Ipswitch Analytics while others are not. |
|
All Agents are offline and none are sending data to Ipswitch Analytics. |
The System Status also shows "X of X systems reporting", so you know at a glance how many Agents are online.
Tip: Click on System Status to show or hide the dashboard. This is helpful when you want to maximize screen space to display more of the graph below.
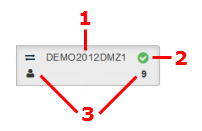
Each Agent inside the dashboard includes the following information:
![]() Agent is online and sending data to Ipswitch Analytics.
Agent is online and sending data to Ipswitch Analytics.
![]() Agent was not able to send data to Ipswitch Analytics in the last minute. After three consecutive failed attempts to send data, status changes to offline
Agent was not able to send data to Ipswitch Analytics in the last minute. After three consecutive failed attempts to send data, status changes to offline ![]() .
.
![]() Agent is offline. There have been at least three consecutive failed attempts to send data. The chart will continue to show historical data for minutes when the Agent was not sending data.
Agent is offline. There have been at least three consecutive failed attempts to send data. The chart will continue to show historical data for minutes when the Agent was not sending data.
Item |
Description |
1 |
Agent Name |
2 |
Status |
3 |
Number of users signed on concurrently |
Click on an Agent to include or exclude data from that MOVEit database in the graph. Selected Agents display with a gray tint in the dashboard, while unselected Agents are white: