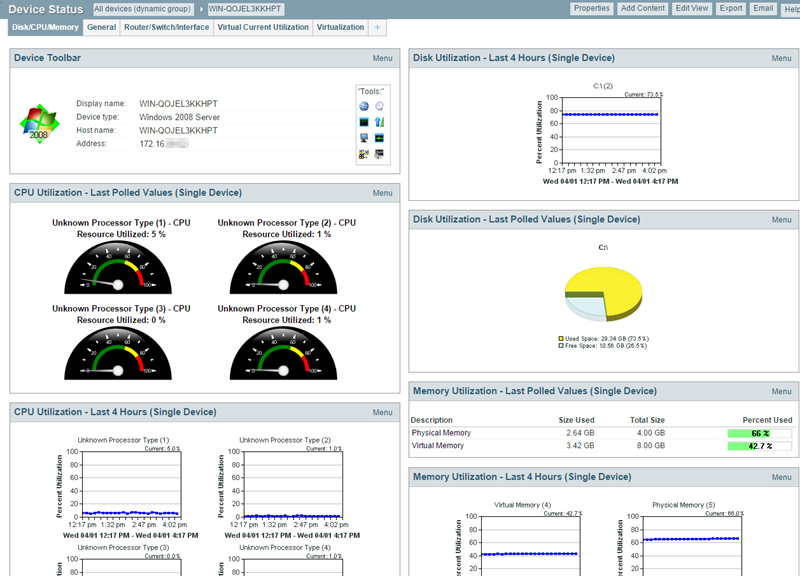
About the Device Status dashboard
Device Status dashboard
The Device Status dashboard is used to view information about a specific device. You can only add single device dashboard reports to the Device Status dashboard.

The Device Status dashboard presents relevant information about the health and performance of a single monitored device. Throughout the web interface you see links to devices, such as ![]() . All of these links point to the Device Status dashboard for that device. If there is a potential problem with a monitored device, the Device Status dashboard is a good place to look for more information on the device status. The Device Status dashboard includes several default dashboard views:
. All of these links point to the Device Status dashboard for that device. If there is a potential problem with a monitored device, the Device Status dashboard is a good place to look for more information on the device status. The Device Status dashboard includes several default dashboard views:
- Disk/CPU/Memory
- General
- Router/Switch/Interface
- Virtual Current Utilization
- Virtualization
The device name displays at the top of the Device Status report. To change the focus of the report to another device without leaving the report, select a new device from the device context in the dashboard title bar.

There are many different types of devices and a variety of features and services that can be monitored. The dashboard views let you select a view that is most appropriate for the individual device. Each time the report is visited, the last view selected for a device displays.
The Disk/CPU/Memory View is the most appropriate view for a Windows or UNIX host that supports the Host Resources MIB for performance monitoring. The Router/Switch/Interface View is the most appropriate view for a manageable Switch or Router that is capable of reporting Interface or Bandwidth utilization.
For more information, see Adding dashboard reports to a dashboard.