Monitoring newly-discovered applications
To monitor newly-discovered applications:
- Identify an application on the list you want to begin monitoring and click Start monitoring.
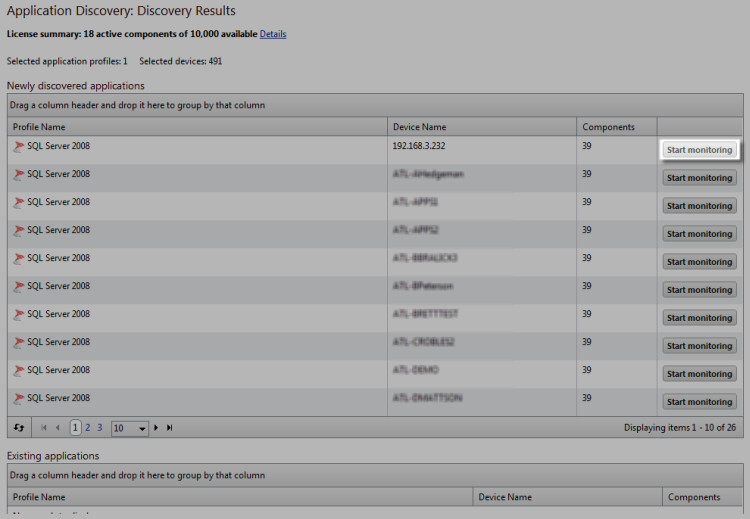
A Start Monitoring Application dialog appears and APM automatically begins testing the application profile components.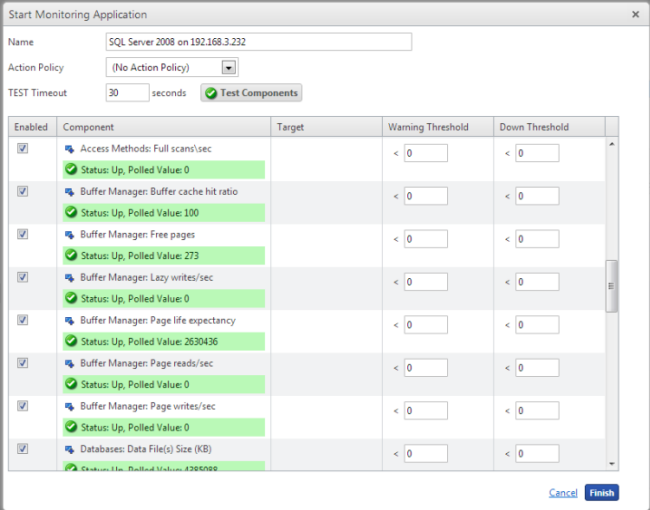
- Use the Start Monitoring Application dialog to make any desired changes to the instance you are creating. The dialog contains the following information:
- Name. Use this box to modify the default name of the application instance.
- Action Policy. Use this list to select an action policy to be applied to the application instance.
- TEST Timeout. Use this box to indicate how long a component test should run prior to timeout.
- Test Components. Use this button to immediately initiate component testing.
- Enabled. Use these check boxes to enable or disable individual components for the Application instance.
- Warning Threshold. Use this box to indicate when APM reports the component is experiencing a problem.
- Down Threshold. Use this box to indicate when APM reports the component as 'Down'.
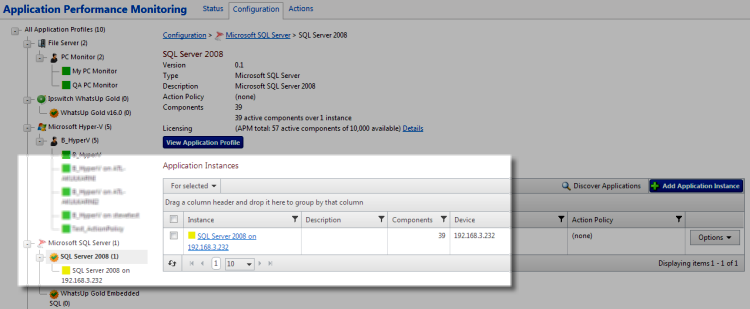
- Click Finish to save the application instance.
- Close the dialog to return to the Application Discovery: Discovery Results page.
- Repeat as needed to create additional application instances.