CPU Utilization
This performance monitor report displays CPU utilization percentages collected during the selected time period from the device displayed at the top of the report.
- Configure the data collection for a device by selecting a device from the Device list and selecting Properties > Performance Monitors > CPU Utilization.
- Configure the data collection for a group by selecting a group from the Device list, selecting Bulk Field Change > Performance Monitors, and then making a selection from the CPU menu.
Device Report: |
Group Report: |
|
|
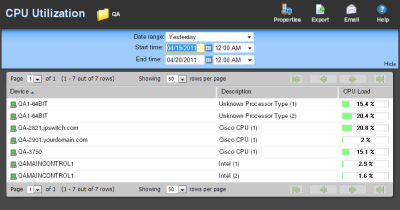
Monitor report body for group reports
The group report displays a list of all devices in the group and the current average CPU load for each CPU in each monitored device for that group. To view the CPU Utilization report for a specific device, click the CPU displayed in the Description column. WhatsUp Gold opens the CPU Utilization device report for that device.
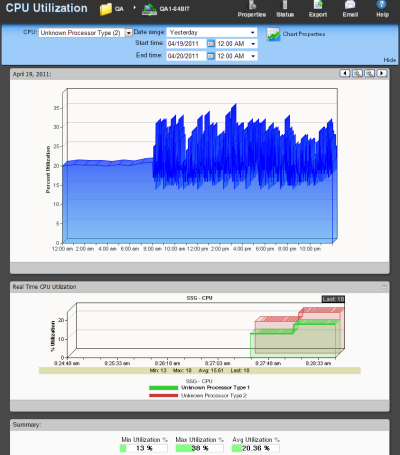
Monitor report body for device reports
Below the control bar is a graph showing the CPU utilization for the selected time period for the device displayed in the title bar. Each point on the graph corresponds with an entry in the graph data table below.
If the currently viewed device contains multiple CPUs, you can select which CPU information to view by making a selection from the CPU menu in the control bar.
When multiple CPUs are present, the following selections are also available:
- The CPU menu lists all available CPUs in the device. You can select any CPU and view utilization information for that CPU.
- All CPUs (average). The average utilization across all CPUs in the device.
- All CPUs. A combined graph displaying utilization for all CPUs.
Split Second Graph - Real-Time CPU Utilization for devices
When you view a device, a Split Second Graph displays under the real-time utilization data for CPUs. When you view a group, hover over the CPU description in the Description column to view the Split Second Graph for that device.
Note: Split Second Graphs are not available in WhatsUp Gold Standard Edition.
Note: Split Second Graphs are not available in VMware host reports.
Note: When viewing information for devices running Microsoft Windows, information gathered via WMI is displayed in real time. Information gathered by SNMP, however, may reflect a delay of one minute or more. This delay is caused by a limitation in how often Microsoft Windows updates SNMP values.
Below the Split Second Graph, the report displays the average CPU utilization percentages collected during the time period:
- Min Utilization %. The minimum CPU utilization percentage experienced.
- Max Utilization %. The maximum CPU utilization percentage experienced.
- Avg Utilization %. The average CPU utilization percentage across all sample data for this time period.
Note: Values displayed in the graph are the average values for the selected time period. Values displayed in the summary are the minimum, maximum, and average values for the selected time period. If raw polling data has been averaged into hourly or daily summarized data, the values for min and average, or maximum and average can be different. In some cases, they may be very different if there was a period of time when polled values were much higher or lower than normal.
You can verify your report rollup settings on the WhatsUp Gold console via Program Options > Report Data.
Note: If you are viewing data for all CPUs on a device the summary section displays the lowest of the minimum CPU utilization percentages experienced across all CPUs, and the highest of the maximum CPU utilization percentages experienced across all CPUs. The average CPU utilization percentage is calculated across all sample data for all CPUs
Changing how the chart looks
Click the Chart Properties button to change how the report chart is displayed.
Navigation
- Change the device you are viewing by clicking the group or device name currently in context and then selecting a new device in the device picker.
- Change to another device monitor report by selecting a different report button.
Viewing Properties
To view the properties of the current group or device, click Properties in the toolbar.