About the Device Health report
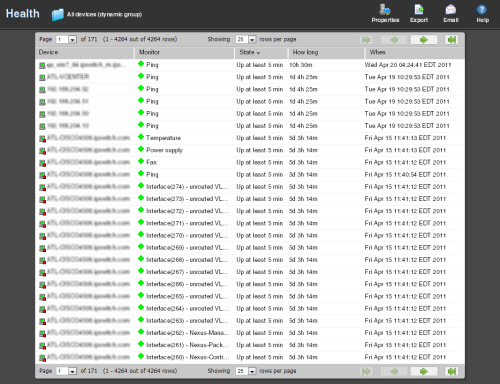
This group report displays the current status of monitored devices in the selected group, along with each monitor configured to those devices.

For more information about what each icon state means, see Device State Legend.
Monitor report body
Below the date/time picker is a table showing the total number of devices in the group collecting data for the time period chosen, and the status of the monitors configured for the devices in that group. The following information displays:
- Device. The network device.
- Monitor. The specific monitor.
- State. The state of the monitor at the time of the last poll.
- How long. The period of time that the monitor has been in the current state.
- When. The date and time the monitor went in to the current state.
Navigation
- Change the device you are viewing by clicking the group or device name currently in context and then selecting a new device in the device picker.
- Change to another device monitor report by selecting a different report button.
Viewing Properties
To view the properties of the current group or device, click Properties in the toolbar.