About the Active Monitor Availability report
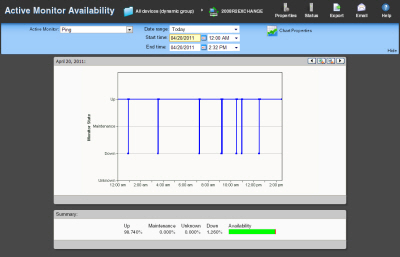
This device monitor report displays an area graph that outlines the availability of the Active Monitors for a device or group of devices.
Device report: |
Group report |
|
|
Monitor report body for device reports
A graph at the top of the monitor report displays the state of the selected active monitor for the device.
Summary for device reports
At the bottom of the graph, the summary section displays:
- Up. The percentage for the amount of time the Active Monitors were up.
- Maintenance. The percentage for the amount of time the Active Monitors were in maintenance.
- Unknown. The percentage for the amount of time the Active Monitors status was unknown.
- Down. The percentage for the amount of time the Active Monitors were down.
- Availability. The overall availability for the Active Monitor by color for the selected time period.
- Green. Percentage of the time device was available.
- Red. Percentage of time the device was unavailable.
- Orange. Percentage of time the device was in maintenance mode.
- Gray. Percentage of time the device was in an unknown state. The state of a device is unknown when the monitors for that device are disabled or deleted, or if a device has an "up" dependency and the device it is dependent upon is down.
Changing how the chart looks
Click the Chart Properties button to change how the report chart is displayed.
Monitor report body for group reports
This group report displays a summary of availability times for all Active Monitors within a device group. The following information is displayed within the report:
- Device. The network device. Click one of the device entries to view the Device Active Monitor Availability Report for that device.
- Monitor. The type of Active Monitor.
- Up. The percentage for the amount of time the Active Monitor was up.
- Maintenance. The percentage for the amount of time the Active Monitor was in maintenance.
- Unknown. The percentage for the amount of time the Active Monitor was in an unknown state.
- Down. The percentage for the amount of time the Active Monitor was down.
- Availability. The overall availability for the Active Monitor by color for the selected time period.
- Green. Percentage of the time device was available.
- Red. Percentage of time the device was unavailable.
- Orange. Percentage of time the device was in maintenance mode.
- Gray. Percentage of time the device was in an unknown state. The state of a device is unknown when the monitors for that device are disabled or deleted, or if a device has an "up" dependency and the device it is dependent upon is down.
Navigation
- Change the device you are viewing by clicking the group or device name currently in context and then selecting a new device in the device picker.
- Change to another device monitor report by selecting a different report button.
Viewing Properties
To view the properties of the current group or device, click Properties in the toolbar.

