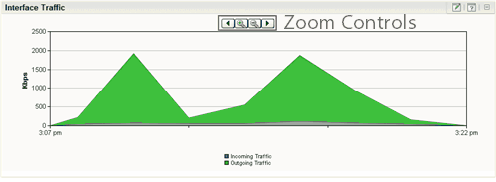
Using zoom controls on line graphs
Dashboard reports that include line graphs, such as the Interface Traffic report, allow you to adjust the window of time for which data is reported using the zoom controls. These controls are located at the top center of the dashboard report.

Zoom controls
|
Moves the graph time frame backward by 50% of the total time of the graph. For example, if the graph shows data from 3:00 PM to 4:00 PM, clicking Page left shifts the time frame of the graph to 2:30 PM to 3:30 PM. |
|
Decreases the amount of time displayed in the report by 50%. For example, if the report is displaying data for one hour, clicking the Zoom in button decrease the display time to 30 minutes. The report must display at least 30 minutes. If you attempt to zoom in on a report that shows 30 minutes, the report refreshes but the time frame is not changed. |
|
Increases the amount of time displayed in the report. For example, if the report is displaying data for 30 minutes, clicking the Zoom out button increases the display time to 1 hour. |
|
Moves the graph time frame forward by 50% of the total time of the graph. For example, if the graph shows data from 3:00 PM to 4:00 PM, clicking Page right shifts the time frame of the graph to 3:30 PM to 4:30 PM. |
 Zoom in
 Zoom out