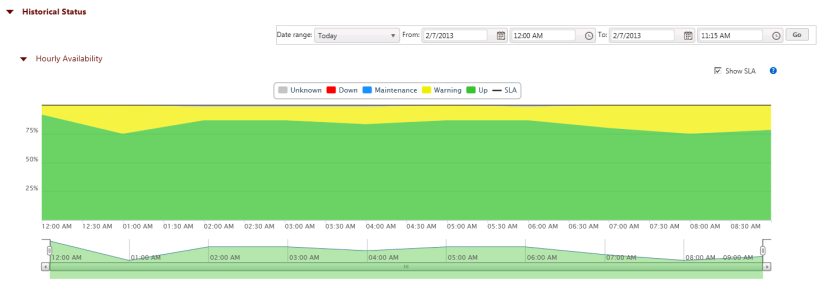
Hourly Availability
The Hourly Availability report displays the percentage of the application instances or components that were in each state (Up, Down, Warning, Maintenance, Disabled, or Unknown) over the defined time period. The scope of this report is defined by the scope you select. The following table describes the information that is displayed at each level in the Application Tree.
Scope |
Displays: |
All Applications |
Percentage of all instances monitored by APM that are in each state over the defined time period. |
Application Type |
Percentage of instances of the selected application type that are in a given state |
Profile |
Percentage of all instances created from the selected profile that are in a given state. |
Instance |
Component State Summary report is visible when Instance is selected. |
Component |
Not available. |
Use the sliders located below the graph to zoom in on a particular time in the defined range.