About the Device Uptime report
This device report displays the uptime status for monitored devices in the selected group.

- For more information about what each icon state means, see Device State Legend.
Monitor report body
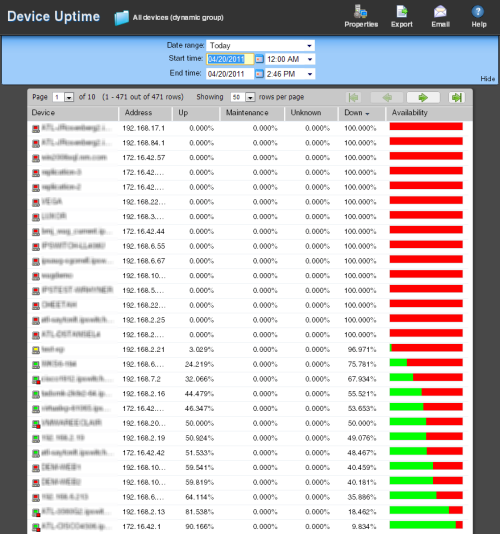
Below the date/time picker is a table showing the devices in the group collecting data for the time period chosen, and the uptime status information for the each device in the group:
- Device. The group device's display name (or IP address if a display name isn't specified in its Device Properties) and device state icon.
- Address. The device IP address monitor.
- Up. The percentage for the amount of time the device was up during the selected time period for all devices.
- Maintenance. The percentage for the amount of time the device was in maintenance during the selected time period for all devices.
- Unknown. The percentage for the amount of time the device status was in an unknown state during the selected time period for all devices.
- Down. The percentage for the amount of time the device was down during the selected time period for all devices.
- Availability. The overall availability for the device during the selected time period, by color. The percentage of the bar shaded red in the Availability column indicates the percentage of time the device was not available, while the percentage shaded green indicates the percentage of time the device was available.
Navigation
- Change the device you are viewing by clicking the group or device name currently in context and then selecting a new device in the device picker.
- Change to another device monitor report by selecting a different report button.
Viewing Properties
To view the properties of the current group or device, click Properties in the toolbar.