Learning about monitor reports
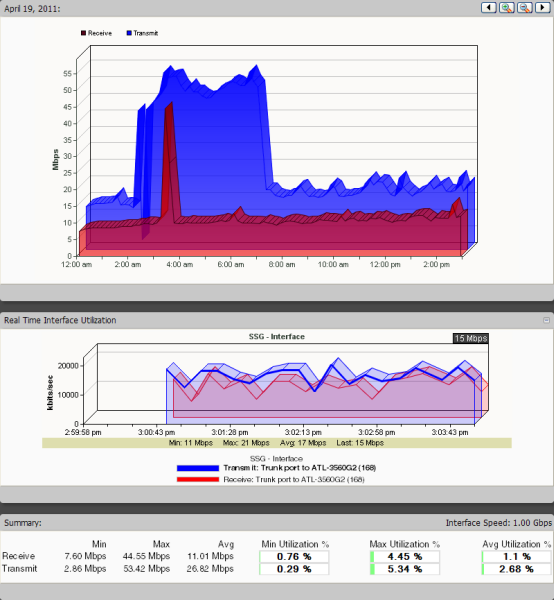
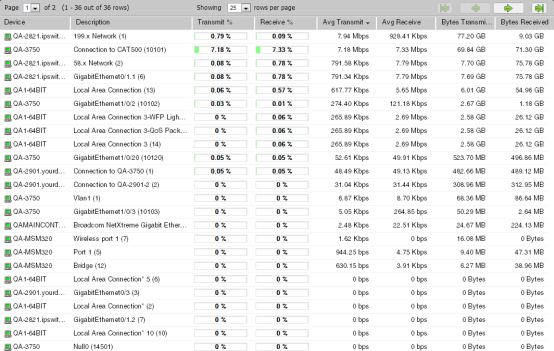
Monitor reports display performance and historical data collected during the operation of the application. You can use these reports to troubleshoot and monitor your network and devices.
You can view monitor information for a device:

You can view monitor information for a group:

Access monitor reports by clicking the Reports tab and then selecting the appropriate button for the type of report you want to view.
Monitor report categories
Monitor reports in WhatsUp Gold are grouped according to the type of information displayed within each report.
There are three categories of monitor reports:
- Performance. Reports which display information about thresholds. Determine which resources on your network are under- or over-utilized using Performance monitor reports.
- Network. Reports which display reports related to network statistics about traffic through your network. Network reports include such parameters as speed, response times, and success or failure in contacting devices.
- Device. These reports display information about specific devices that you select to to monitor for parameters such as outages and uptime percentages.
Advantages of monitor reports
- Larger than dashboard reports, monitor reports give you a broader data view, which is useful in pinpointing the time an event occurred or when viewing multiple graphed items. Many dashboard reports link to monitor reports, so that you can access this larger data view to troubleshoot.
- The date range on full reports can be zoomed in or out so that you can get a smaller or larger picture of what's going on with an aspect of the network.
- Click the options within the same tab in the navigation bar to quickly access other monitor reports. The currently selected group or device and date range is applied to the next monitor report you access.
- The data in monitor reports can be exported to a formatted text file, Microsoft Excel, or a PDF. You can also email reports as a PDF, or send on scheduled intervals.