Using the Web Performance Monitor
The Web Performance Monitor extends the functionality of the Microsoft Windows Performance Monitor to the Web. It is a data collecting and graphing utility designed specifically for the WhatsUp Gold web interface that graphs and displays real-time information on user-specified SNMP and WMI performance counters. It can be used for a quick inspection of a specific network device.
The graphs can be saved to the database and displayed on dashboard views using the Split Second Graph - Performance Monitor dashboard report or on the Web Performance Monitor tool. Multiple SNMP and WMI counters can be displayed on a single graph, and the color and scale of each graphed item can be individually configured.
Graphs created with the Web Performance Monitor are saved on a per-user account basis, meaning, graphs are only accessible by the user account that created and saved them.
The Web Performance Monitor has two purposes:
- To provide a Web enabled WMI and SNMP performance counter poller and grapher. It supports WMI for Windows servers, and SNMP for network devices such as switches, routers, and UNIX devices.
- To build and edit graphs for use by the Performance Monitor dashboard report. You can use this dashboard report to display any saved graph.
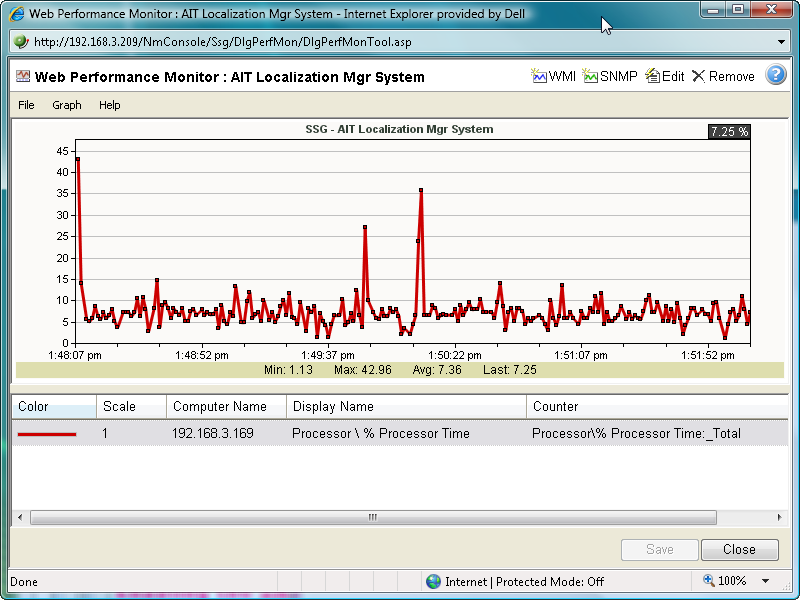
To add a WMI performance counter to the Web Performance Monitor:
- Click Tools > Web Performance Monitor. The Web Performance Monitor appears.
- Click Graph > Add WMI Counter.
- or -
Click the WMI button in the upper right corner of the dialog (see the Toolbar buttons table below). The Add WMI Performance Counter dialog appears.
- Enter the appropriate information into the dialog boxes.
- Click OK to save changes.
To add an SNMP performance counter to the Web Performance Monitor:
- Click Tools > Web Performance Monitor. The Web Performance Monitor appears.
- Click Graph > Add SNMP Performance Monitor.
- or -
Click the SNMP button in the upper right corner of the dialog (see the Toolbar buttons table below). The Add SNMP Performance Counter dialog appears.
- Enter the appropriate information into the dialog boxes.
- Click OK to save changes.
Web Performance Monitor menu items
The Web Performance Monitor menu is located at the top left corner of the window.
File menu
- File > New Graph. This menu item resets the graph back to a blank graph.
- File > Edit Graph Name. This menu item lets you change the name of the selected graph.
- File > Load Graph. This opens the Load Graph dialog, which displays a list of saved graph files on the Web server.
- File > Save Graph. This saves the current graph to the database. If no filename is specified, it launches the Save Graph dialog, which allows a filename to be specified. All files are saved to the WhatsUp database.
- File > Save Graph As. This opens the Save Graph dialog which prompts you for a filename, and then saves the current graph to disk.
- Windows Properties. This opens the Configure Window Properties dialog. Use this dialog to configure the graph and window properties for the Web Performance Monitor.
Graph menu
- Graph > Add WMI Performance Counter. This launches the Add WMI Performance Counter dialog.
- Graph > Add SNMP Performance Counter. This launches the Add SNMP Performance Counter dialog.
- Graph > Edit Selected Counter. This launches the appropriate dialog for editing the selected WMI or SNMP performance counter.
- Graph > Remove Selected Counter. This removes the selected counter from the list and graph. No changes are saved to disk until the OK button is clicked or the graph is manually saved (File > Save Graph - or - Save Graph As).
Help menu
- Help > Help. This launches help for the Web Performance Monitor.
Web Performance Monitor Toolbar buttons
The Web Performance Monitor Toolbar is located at the top right corner of the window.
Button |
Function |
|
Opens the Add WMI Performance Counter dialog. |
|
Opens the Add SNMP Performance Counter dialog. |
|
Opens the appropriate dialog for editing the selected WMI or SNMP performance counter. |
|
Removes the selected graph item from the list and graph. |
|
Opens the help topic for the Web Performance Monitor |
For troubleshooting information, see Troubleshooting SNMP and WMI connections.