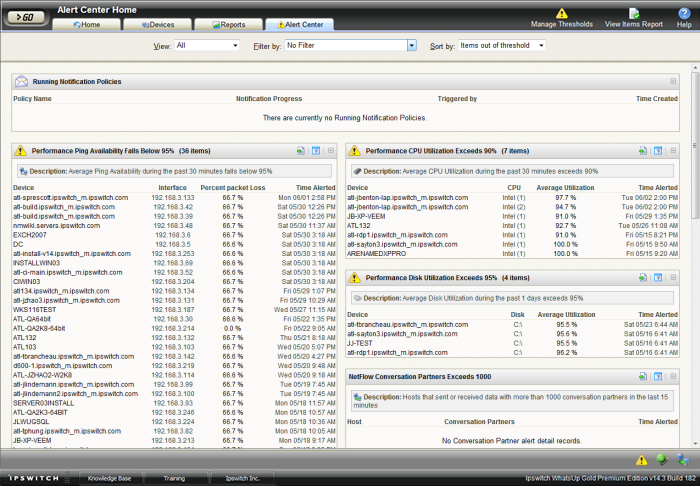
About Alert Center Home
Alert Center Home displays running notification policies and workspace reports for configured Alert Center thresholds.

Filtering data
You can sort the data displayed on this page in several ways using the three lists at the top of the page.
- View. You can view All items, only those items that are Out of threshold, or only those items that are In threshold.
- Filter by. You filter data by any one threshold, all thresholds of a particular type, or apply No filter.
- Sort by. You can sort the thresholds displayed by Items out of threshold, or Alphabetically.
Running Notification Policies
This section of Alert Center Home displays the following data for any notification policy that is currently running.
- Policy name displays the notification policy name, as configured in the Notification Policy Library.
Tip: Click a policy name to view current and historical data for the notification policy.
- Notification progress displays the current step of the policy.
- Triggered by displays the threshold that caused the notification policy to begin.
- Time created displays the time the notification policy began.
Tip: Click the Running Notification Policies title bar to view the Running Notification Policies report.
Threshold workspace reports
Each threshold workspace report displays data relevant to that threshold type.
Note: Items that have been acknowledged display a green check mark ![]() next to their name on Alert Center Home threshold workspace reports.
next to their name on Alert Center Home threshold workspace reports.
Threshold workspace report title bar
- The threshold workspace report title is populated with the threshold name, as configured in the Threshold Library.
- Threshold's with alarmed items display an Alert icon
 .
. - The number of out of threshold items is displayed in parenthesis next to the threshold name.
- Click a title bar to configure that threshold.
- Click the Export
 button to export data for a workspace report to a text file, Microsoft Excel, or a .PDF. For more information, see Alert Center Export Settings.
 - Click the Help
 button to view help for a threshold workspace report.
 - Use the expand
 and collapse
  buttons on the workspace report title bar to show or hide threshold report data.
Service icons
WhatsUp Gold service icons are located at the bottom right of the page. These icons display information about the Alert Center, WhatsUp Gold, and Flow Monitor service. Position the mouse cursor over an icon to view status information.
|
Position the mouse cursor over the Alert Center service icon to view the service's current status. Click the icon to view the Alert Center Service dialog, where you can stop and restart the service. |
|
Position the mouse cursor over the WhatsUp Engine service icon to view the service's current status. Click the icon to view the WhatsUp Engine Service dialog, where you can stop and restart the service. |
|
Position the mouse cursor over the Flow Service icon to view the service's current status. Click the icon to view the Flow Service dialog, where you can stop and restart the service. |
Title bar quick links
There are several quick links at the top of the page you can use to access different parts of the Alert Center or Online Help.
- Click Manage Thresholds to view the Threshold Library.
- Click View Items Report to view the Alert Center Items Report.
- Click Help to view help for this page.