Configuring a custom threshold
To configure a Flow custom threshold:
- Go to the Alert Center Home page:
- From the web interface, click GO. The GO menu appears.
- If the WhatsUp section is not visible, click WhatsUp. The WhatsUp section of the GO menu appears.
- Select Alert Center. The Alert Center Home page appears.
- Click Manage Thresholds. The Alert Center Threshold Library appears.
- Click New. The Select Threshold Type dialog appears.
- Select Flow Custom Threshold, then click OK. The New/Edit Flow Custom Threshold dialog appears.

- Specify or select the appropriate information in the dialog fields:
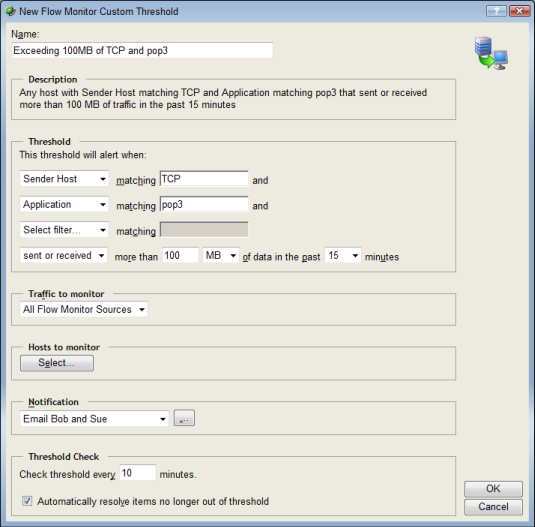
Specify a Name for the threshold; this name is displayed as the threshold's workspace report title on the Alert Center Home page.
Description
As you specify the desired threshold criteria settings, this description updates to verbally illustrate the threshold you have configured.
Threshold
Select and enter the desired threshold criteria variables and values. You have the ability to select up to three NetFlow filters for which to match threshold values.
An example threshold involving multiple filters could read, "This threshold will alert when any host with Protocol matching TCP and Application matching pop3 sent or received more than 100 MB of data in the past 15 minutes."
The default threshold time value is data in the past 15 minutes.
Traffic to monitor
Select the Flow Monitor source or interface from which to monitor traffic. If you select a source, traffic for all interfaces on the source is monitored; if you select an interface, only traffic for the specific interface is monitored. By default, the threshold is set to monitor traffic from all Flow Monitor sources.
Note: Sources sending sampled data are not displayed as a selection option in the Traffic to monitor list because Flow Monitor cannot determine that traffic has failed on sampled data.
Hosts to monitor
Click Select to choose the hosts to which the threshold applies. By default, the threshold monitors all applicable hosts.
Notification
Select the notification policy you would like to apply to this threshold. This policy begins sending notifications when an item falls out of the threshold you configure above. If you do not see an appropriate threshold policy, or if the list is empty, browse (...) to the Notification Policy dialog to configure a new policy.
Note: It is not required that you select a notification policy for use with every threshold. If you do not select a notification policy, no notifications are generated for the threshold, but a workspace report with the out of threshold items will still appear on the Alert Center Home page.
Threshold check
Enter a value for the threshold check interval, or the interval at which the Alert Center checks the WhatsUp Gold database to see if there are items that are out of the threshold's parameters. The default polling interval is 3 minutes.
Select Automatically resolve items no longer out of threshold to have Alert Center automatically resolve items when they go back inside the parameters of the threshold.
Note: We advise that your threshold check interval be longer than the amount of time for which you are gathering data for this threshold. For example, if you have devices which are set to collect CPU performance data every 10 minutes, then your Alert Center CPU threshold check interval should be set to 10 minutes or more. If the threshold check interval is shorter than the data sample period, the Alert Center may miss data relevant to the threshold.
- Click OK to save changes.