Top Sender ASN
Top Sender ASN report reveals organizations identified by provider ASNs sending the most traffic for the selected interval.
- . Autonomous System Number when supplied by systems using Border Gateway Protocol (BGP).
- . Organization name associated with the top sender ASN.
- . Number of bytes transmitted. Use Report Settings
 to sort by packet or flow count, or bytes.
 - . Average bit rate, in bits per second (bps).
- . Percentage of the total traffic.
To display Flow and Packet measurements, click a column heading ( ) for column selection list (
 ). You can also include:
- . Fraction of total bandwidth capacity used. "N/A" denotes the measurement cannot be calculated because the bandwidth capability is unknown for the current interface.
: You can hover over a host name to display popup information about the hostname's IP address. If you click the hostname, a filter is created that uses the host as the filter criteria and the Interface Details dashboard reloads with this filter applied.
: You can hover over the icon preceding the Senders host name to display WHOIS information about the host. This information is gathered using a WHOIS query of the American Registry for Internet Numbers (ARIN).
: To show reports in full screen with most if not all possible columns, click on report options ( ) menu and choose (
 ).
).
Generate a report
.  ,
,  Choose a networking device or single physical or virtual interface you want to see Top Sender ASN measurements for. Choose traffic direction across an interface.
Use the Select Device dialog for one of the following:
Control
|
Description
|
Device.
|
Browse and choose a networking device that is a Network Traffic Analyzer monitoring source. (For example, wireless router, router, and more)
|
Network Interface.
|
- Choose a single physical or virtual interface Network Traffic Analyzer you want traffic statistics for.
- Choose direction of traffic over the network interface (, , , or for invalid traffic.).
|
Network. 
|
Network devices known to NTA.
|
.  Choose times for the Top Sender ASN. (Subject to NTA collection interval and retention policies.)
Choose time constraints for your NTA data view
Date Range . Choose or define an overall window of time network activity data.
: Detail rendered in graphs depends on the time window you choose (Date Range) along with how long your system retains raw, hourly, and daily time-series data (NTA data collection and Data Retention settings). NTA graphs network activity as time-series averaged over daily intervals, hourly intervals, or over shorter periods (raw). Raw data interval is defined by the data collection interval in NTA settings.
: If you choose a time window outside of your NTA default data retention limits (8 hours for Raw and 10 days for Hourly, for example) your graph will default to an interval detail of Daily.
Detail Revealed with Default Retention Settings
Over time, the NTA collector cleans up older data. Eventually, collected data is combined into daily totals at the rates shown in the following table. If your site's mission and database capacity allow for more detailed data be retained for longer periods, increase the default retention settings in the NTA Settings dialog ( menu ).
Report Time Window Selection
|
Data Interval Shown in Graph (default retention settings)
|
Example
|
0 – 7 hours
|
Raw
- Data interval = every two minutes.
- Default data retention = 7 hours plus the current fraction of an hour (unless extended in NTA Settings).
|
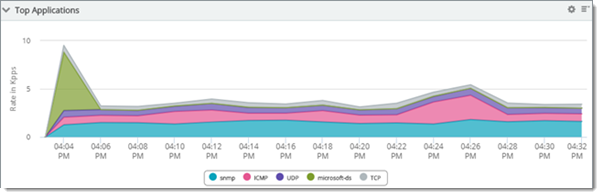
Top Applications observed over the last 30 minutes (raw)
|
more than 8 hours within the past 9 days
|
Hourly
- Data interval = every hour.
- Default data retention = 9 days plus the current fraction of a day (unless extended in NTA Settings).
|
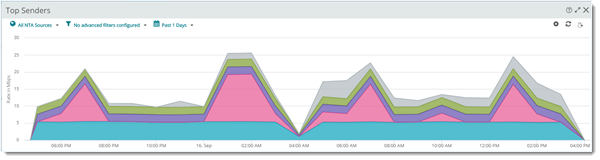
Top Senders over the last day (hourly)
|
10 days or more
|
Daily
Data interval = every 24 hours.
Daily is also the Archive data interval.
|
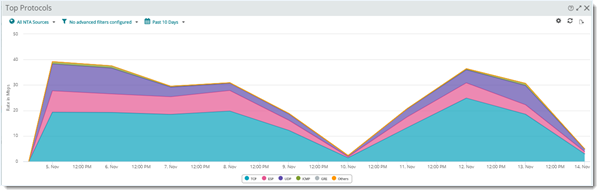
Top Protocols over the last 10 days (daily)
|
. Choose and hide columns, reorder columns, and apply advanced filters  to customize your data view.
Filter and pick by column
Click a report heading () and use the "column picker" () from the drop down list.
Control
|
Purpose
|
Columns.
|
Click a check box to display the column. Clear the check box to hide it.
|
Move Column.
|
Click on a column heading and drag it to reorder your table's columns.
|
Advanced Filtering.
|
Apply category, pattern, and keyword filtering to column data.
|
. Fine tune report presentation and range of values displayed using the Report Settings dialog (optional).
Specify threshold and top n:
Control
|
Purpose
|
Show Top n Items
|
Limit items to the samples with the highest (or lowest) interface errors.
|
Threshold Type
|
Switch between minimum or maximum mode for cutoff values for the ranked list.
- At or Over. Show peak occurrence period. (Observations equal to or greater than Threshold.)
- At or Under. Show occurrences equal to or less than Threshold.
|
Threshold (percent)
|
Baseline value used to trim ranked device list based on peak or subpeak periods when returning the Top n.
|
Chart and visualize data over time (single device  )
)
Charting and visualization is available when you select a single device.
Control
|
Purpose
|
Display Options
|
Present data as a chart, a table grid, or both.
|
Chart Type
|
- Gauge charts. Available when you select a Date Range of .
- Time series. Available when you select a Date Range interval (, for example).
- Line/Area. Scatter graph that connects adjacent measurements with straight lines.
- Spline/Area Spline. Choose a graph with a smoothed appearance where adjacent samples exhibit a gradual slope.
|
Chart Options
|
- Legend, Grid Lines, Range Selector. Include legend, grid lines, and range selector for readability.
- Trend Lines. Present data with a smoothed average to show trend.
- Vertical Axis Scale. Automatically scale to fit data or specify a finite range.
|
: Trend lines represent a moving average that can be compared with line and area graphs to reveal peak and sub peak intervals, collision periods, and indicate transmission problems.
Share, export, and save as PDF
Most generated Top Sender ASN report data can be printed, shared, and exported when selecting () from the Dashboard Options ( ) menu. After the report has been expanded, select export (
 ) to access the following options:
 Choose source.