Traffic Totals
Traffic Totals report reveals incoming and outgoing traffic and bandwidth totals for the selected interval.
- . Incoming or Outgoing.
- . Metrics that include only the 95th percentile. Top 5% inbound and outbound peaks are clipped and discarded.
- . Peak value.
- . Combined (incoming/outgoing) number of bytes transferred. (Use Report Settings
 option to rank the list by packet or flow count, not bytes.)
 - . Total average bit rate.
- . Percentage of total bandwidth.
To display Flow and Packet measurements, click a column heading ( ) for column selection list (
 ). You can also include:
- . Fraction of total bandwidth capacity used. "N/A" denotes the measurement cannot be calculated because the bandwidth capability is unknown for the current interface.
Generate a report
.  ,
,  Choose a networking device or single physical or virtual interface you want to see Traffic Totals measurements for. Choose traffic direction across an interface.
Use the Select Device dialog for one of the following:
Control
|
Description
|
Device.
|
Browse and choose a networking device that is a Network Traffic Analyzer monitoring source. (For example, wireless router, router, and more)
|
Network Interface.
|
- Choose a single physical or virtual interface Network Traffic Analyzer you want traffic statistics for.
- Choose direction of traffic over the network interface (, , , or for invalid traffic.).
|
Network. 
|
Network devices known to NTA.
|
.  Choose times for the Traffic Totals. (Subject to NTA collection interval and retention policies.)
Choose time constraints for your NTA data view
Date Range . Choose or define an overall window of time network activity data.
: Detail rendered in graphs depends on the time window you choose (Date Range) along with how long your system retains raw, hourly, and daily time-series data (NTA data collection and Data Retention settings). NTA graphs network activity as time-series averaged over daily intervals, hourly intervals, or over shorter periods (raw). Raw data interval is defined by the Data Collection interval value in NTA settings.
: If you choose a time window outside of your NTA default data retention limits (47 hours for Raw and 19 days for Hourly, for example) your graph will default to an interval detail of Daily.
Detail Revealed with Default Retention Settings
Over time, the NTA collector cleans up older data. Eventually, collected data is combined into daily totals at the rates shown in the following table. If your site's mission and database capacity allow for more detailed data be retained for longer periods, increase the default retention settings for in the NTA Settings dialog ( menu ).
Report Time Window Selection
|
Data Interval Shown in Graph (default retention settings)
|
Example
|
0 – 47 hours
|
Raw
- Data interval = every two minutes.
- Default data retention = two days up to now. In other words, 47 hours plus the current fraction of the ongoing hour (unless extended in NTA Settings - Interface Data).
|
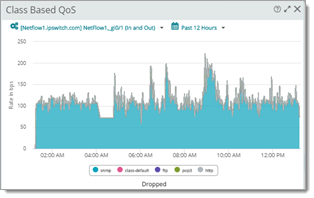
Class Based Quality of Service past 12 hours (raw detail dropped packets)
|
past 48 hours within the past 19 days
|
Hourly
- Data interval = every hour.
- Default data retention = 19 days plus the current fraction of a day (unless extended in NTA Settings - Interface Data).
|
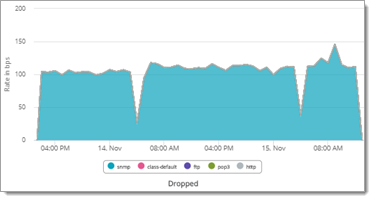
Class Based Quality of Service last two days (hourly dropped packets)
|
20 days or more
|
Daily
Data interval = every 24 hours.
Daily is also the Archive data interval.
|
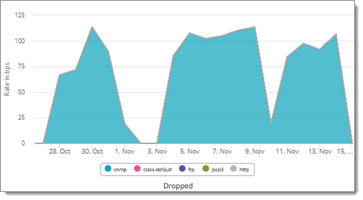
Class Based Quality of Service over the last 20 days (daily dropped packets)
|
. Choose, hide, and reorder columns to customize your data view.
Filter and pick by column
Click a report heading () and use the "column picker" () from the drop down list.
Control
|
Purpose
|
Columns.
|
Click a check box to display the column. Clear the check box to hide it.
|
Move Column.
|
Click on a column heading and drag it to reorder your table's columns.
|
Advanced Filtering. 
|
Apply category, pattern, and keyword filtering to column data.
|
: The totals for this report are gathered by direct polling selected interfaces running on the target device. Advanced Filters can be applied only for reports generated from flow summary data.
. Apply chart, geo mapping (World Map), and display options in Report Settings dialog (optional).
Specify threshold and top n:
Control
|
Purpose
|
Show Top n Items
|
Limit items to the samples with the highest values.
|
Sort by Field
|
Select a column to sort by (if applicable).
|
Chart and view options
Control
|
Purpose
|
View Options
|
Select/clear the checkboxes to display/hide
- Totals. Display totals for each column.
- Others. Remainder values that do not make the top n.
- Chart. Display the selected Chart Type
- Legend. Include legend and grid lines for readability, show rotation angle of map, and more.
- Trend Lines. Present data a smoothed average to show trend.
|
Chart Type
|
Select a chart type and associated options:
- Pie. Pie distribution chart.
- Line/Area. Scatter graph that connects adjacent measurements with straight lines.
- Spline/Area Spline. Choose a graph with a smoothed appearance where adjacent samples exhibit a gradual slope.
- Vertical Bar/Horizontal Bar. Vertical or horizontal bar chart/histogram.
- World Map. Visualize your network traffic by location using a geographic map view within the report area. For information on World Map report navigation, please see Working with NTA reports using the world map.
|
Y-Axis Scale
|
Scale Y-axis (chart and graph height) automatically or choose a fixed size.
|
Export report data
Report data can be exported from WhatsUp Gold, reused, and distributed in multiple formats. Select ( ) from the Dashboard Options (
 ) menu. After the report has been expanded, select the Export Data icon to access the following options:
- . Generate and download a .htm file presenting your report data as it appears in the WhatsUp Gold user interface.
- . Generate and download a .xml spreadsheet containing your report data.
- .Generate and download a .csv file containing your report data.
- Generate and download a .txt file containing your report data.
- . Set a recurring date and time, format, and email destination for report data export.
: Current report data file format options are only applicable to export schedules created using WhatsUp Gold version 2021 and later. Any report data export schedule created using an earlier version of WhatsUp Gold will still result in a .PDF output until that schedule is removed from, then recreated in the Scheduled Reports Library using the latest version of WhatsUp Gold.
 Choose source.