Adding monitors to the Performance Monitor Library
Performance Monitors gather specific types of data on the devices to which they are assigned. System wide monitors are configured using the Performance Monitor Library, but you can also create specific SNMP and WMI monitors to be used on a per-device basis. The default performance monitors (CPU, memory, disk, and interface utilization; and ping latency and availability) cannot be edited or changed from their default settings. By creating custom performance monitors, you can adjust the settings to fit your specific monitoring needs.
To create custom performance monitors (for system wide use):
- From the web interface, select GO.
- On the WhatsUp section, select Configure > Performance Monitor Library. The Performance Monitor Library dialog appears.
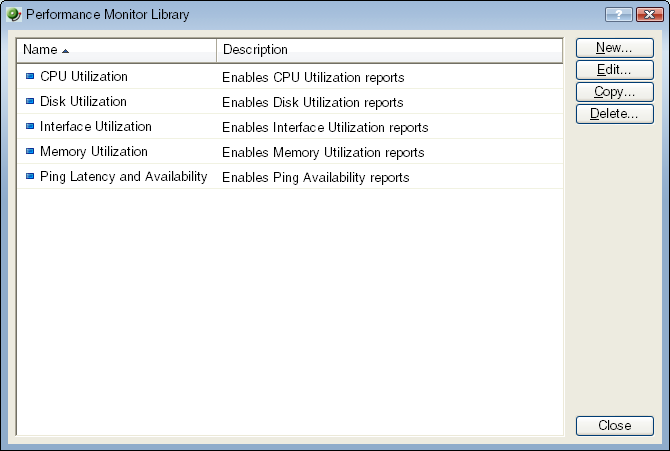
- Click New.
- Select the monitor type: SNMP Performance Monitor, WMI Performance Monitor, or Active Script Performance Monitor, then click OK.
- Follow the instructions below for the type of monitor you choose.
To configure an SNMP monitor:
- In the Add SNMP Performance Counter dialog, enter a Name and Description for the monitor as it will appear in the Performance Monitor Library. Either enter the Performance counter OID and Instance or click the browse (...) button next to the Instance box to go to the SNMP MIB Walker dialog.
- In the MIB Browser dialog, enter the share name or IP address of the computer in which you want to connect.
- Enter the SNMP credential used to connect to the device (or click the browse (...) button to access the Credentials Library to create a new credential).
- If needed, adjust the Timeout and Retries count for the connection to the device.
- Click OK. The SNMP MIB Walker appears.
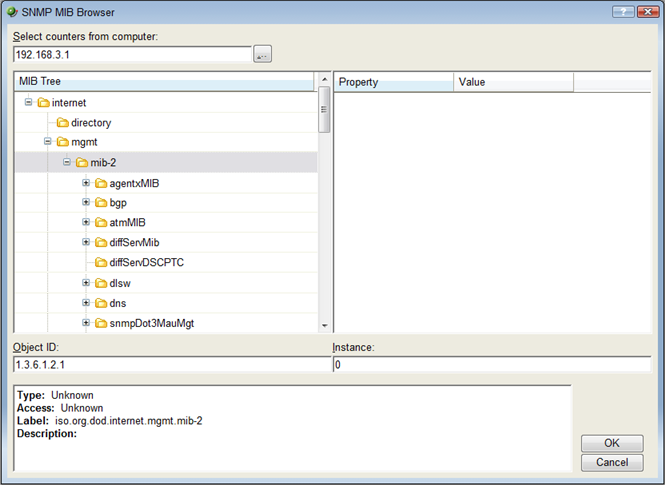
- Use the navigation tree in the left panel to select the specific MIB you want to monitor for the selected computer or device.
- In the right pane, select the Property of that MIB you want to monitor. You can view more information about the property/value pair at the bottom of the dialog.
- Click OK to add the OID to the Performance counter and Instance box in the Add SNMP Performance counter dialog.
- Verify the configuration and click OK to add the monitor to the Performance Monitor Library.
Note: After the monitor has been added to the library, make sure that you enable that monitor through Device Properties > Performance Monitors for that device or other devices.
To configure a WMI monitor:
- On the Add WMI Performance Counter dialog, enter a Name and Description for the monitor, as it will appear in the Performance Monitor Library.
- Click the browse (...) button next to Instance. The Performance Counters dialog appears.
- Enter the computer name or IP address of the computer in which you want to connect.
- Select a credential from a list of Windows credentials (pulled from the Credentials Library), then click OK to connect to the computer.
- Use the Performance counter tree to navigate to the performance counter you want to monitor.
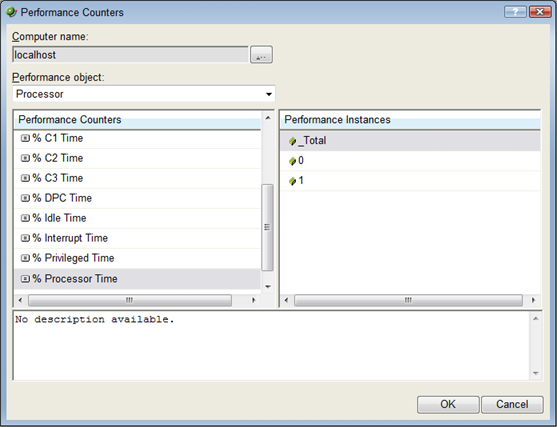
- After you select the performance counter, select the specific instance you want to monitor.
- Click OK to add the counter and instance to the Add Performance Counter dialog.
- Verify the configuration and click OK to add the monitor to the Performance Monitor Library.
Note: After the monitor has been added to the library, you can enable that monitor through Device Properties > Performance Monitors for that device or other devices.
To configure an SNMP active script performance monitor:
- On the Add Active Script Performance Monitor dialog, enter a Name and Description for the monitor as it will appear in the Performance Monitor Library.
- Enter a number for the timeout (in seconds).
- Choose the type of script (JScript or VBScript) you will be using to write the monitor from the Script type list.
- Add a new variable to the Reference Variables list by clicking Add.
Important: You can add up to 10 reference variables to the monitor.
- On the Add reference variables dialog, enter a name and description for the variable.
- Select the type of object (SNMP or WMI) from the Object type list.
- If needed, adjust the Timeout and Retries count for connection to the device.
- Click the browse (...) button next to Instance. The SNMP MIB Browser appears.
- Enter the share name or IP address of the computer in which you are trying to connect.
- Enter the SNMP credential used to connect to the device (or click the browse (...) button to access the Credentials Library to create a new credential).
- If needed, adjust the Timeout and Retries count for the computer in which you are trying to connect.
- Click OK. The SNMP MIB Walker appears.
- Use the navigation tree in the left panel to select the specific MIB you want to monitor. You can view more information about the property/value at the bottom of the dialog.
- Click OK to add the OID to the Performance counter and Instance box in the Add new reference variable dialog.
- Verify the configuration and click OK to add the variable to the Reference variable list on the Add active script performance monitor dialog.
- Write or paste your monitor code in the Script text box.
- Click OK to save changes and add the monitor to the Performance Monitor Library.
To configure a WMI active script performance monitor:
- On the Add Active Script Performance Monitor dialog, enter a Name and Description for the monitor as it will appear in the Performance Monitor Library.
- Enter a number for the timeout (in seconds).
- Choose the type of script (JScript or VBScript) you will be using to write the monitor from the Script type list.
- Add a new variable to the Reference Variables list by clicking Add.
Important: You can add up to 10 reference variables to the monitor.
- On the Add reference variables dialog, enter a name and description for the variable.
- Select the type of object (SNMP or WMI) from the Object type list.
- Click the Browse (...) button next to the Instance box.
- In the dialog that appears, enter the share name or IP address of the computer in which you want to connect.
- Enter the domain and user login for the account on this computer. If a domain account is used, then the expected user name is
<domain>\<user>. If the device is on a workgroup, there are two possible user names: workgroup<name>\<user>or machine<name>\<user>. - Enter a password for the login used above and click OK to connect to the computer.
- Use the Performance counter tree to navigate to the performance counter you want to monitor.
- Once you select the performance counter, select the specific instance you want to monitor.
- Click OK to add the variable to the Reference variable list on the Add active script performance monitor dialog.
- Write or paste your monitor code in the Script text box.
- Click OK to save changes and to add the monitor to the Performance Monitor Library.