Configuring and enabling Performance Monitors
WhatsUp Gold is installed with five performance monitors that monitor specific types of data on your devices: CPU, Disk, Memory, and Interface Utilization; and Ping Latency and Availability. These monitors appear in the Performance Monitor Library.
To configure these monitors for use on specific devices, you must use either the Device Properties > Performance Monitors to configure for a single device, or Bulk Field Change > Performance Monitors to configure for multiple devices.
To enable a global performance monitor for a single device:
- In Device View, select a device from the device list.
- Right-click and choose Properties from the right-menu to view the device's Device Properties.
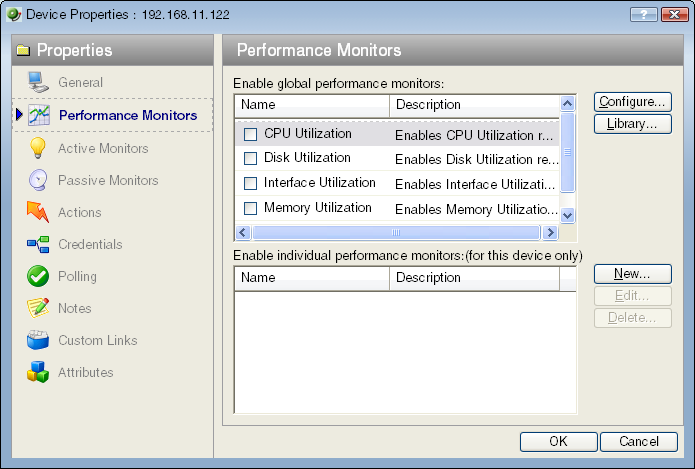
- Click Performance Monitors to view the Performance Monitors dialog.
From the top section of the dialog, select the global performance monitor you would like to enable for the selected device.
Important: To enable a CPU, disk, interface, or memory global Performance Monitor, you must first select and SNMP credential for the device from the SNMP credential page.
- Click OK to save the changes.
To configure a global performance monitor:
- In Device View, select a device from the device list.
- Right-click and choose Properties from the right-menu to view the device's Device Properties.
- Click Performance Monitors to view the Performance Monitors dialog.
- In the top section of the dialog, you can select a global performance monitor, then click Configure.
On the monitor configuration dialog, select the specific item you want to monitor by making a selection in the Collect data for drop-down list. Depending on the monitor, you can select to collect data for All, Active, Specific, or Default interfaces, memories, CPUs, or disks.
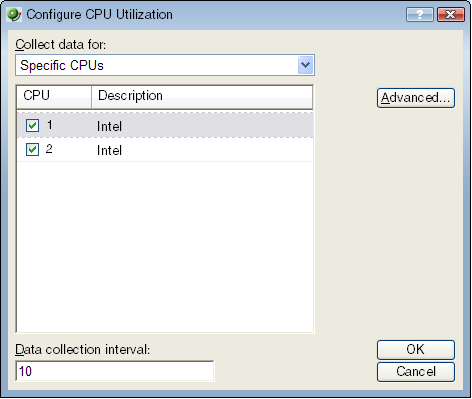
If you select Specific, the list is enabled and you can select or clear the selection for any of the items in the list. This is particularly useful with the Interface Utilization monitor where a device may have many interfaces.
- Select the Data collection interval. This is the amount of time between performance polls.
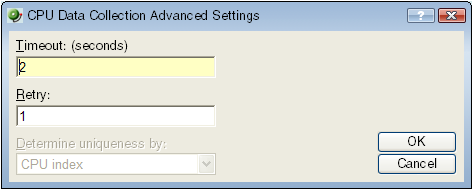
- Click Advanced to change connection settings on the device.
- Click OK to save the changes.
To enable a global performance monitor for multiple devices, use the Bulk Field Change feature for performance monitors.
For information on the Active Script Performance Monitor, see Adding custom performance monitors to the Performance Monitor Library.