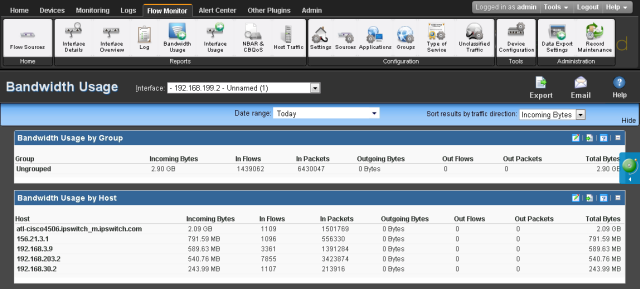
About the Flow Bandwidth Usage report
The Bandwidth Usage report displays network bandwidth usage information.

The report consists of Flow Monitor dashboard reports that summarize the incoming and outgoing traffic for Flow Monitor groups and hosts.
- Bandwidth Usage by Group displays bandwidth usage summaries for the top <n> Flow Monitor groups for the selected time period.
- Bandwidth Usage by Host displays bandwidth usage summaries for the top <n> hosts that are using the most bandwidth during the selected time period.
There are several ways you can refine this report.
- Select a different interface. Use the Interface list at the top of the page to select the interface for which the report data displays.
- Sort results by traffic direction. Use the Sort by traffic direction list at the top of the page to select a direction for which the report data is displayed. Select Incoming, Outgoing, or Total.
- Selecting a different date range. Use the Date range list at the top of the report to change the timeframe for which report data is displayed. If you select Custom, you will be prompted to enter a start and end time for the date range. For more information, see Filtering by date and time.
Note: Flow Monitor only displays data from one database at a time, and by default, displays the most current data. If you select a time period that includes data stored in both the Flow Monitor database and the Flow Monitor Archive database, a note displays below the date range informing you that not all data is shown for the specified date range. For example, if you select a date that includes 39 days of archived data, and one hour of current data, one hour of current data is displayed in the report. You must modify the report's date to view the archived data.
Configuring the dashboard reports in this report
In addition to customizing the report data, there are several ways you can configure the individual dashboard reports within the Bandwidth Usage report.
- Configure the report. Use the configure button on a dashboard report menu to change the report configuration. For more information, see Configuring dashboard reports.
- Expand and collapse dashboard reports. Use the collapse and expand buttons on the report toolbar to open and close the dashboard reports within the report.
Note: Collapsing a dashboard report does not remove it from the report. Instead, it collapses the dashboard report data and displays only the dashboard report title bar.
Exporting, emailing, scheduling and managing reports
Use the Export ![]() icon, at the top right of the page, to export reports. Use the Email
icon, at the top right of the page, to export reports. Use the Email ![]() icon to E-mail a report or to manage Scheduled Reports. For more information see, Using Scheduled Reports in Flow Monitor: printing, exporting, and emailing reports.
icon to E-mail a report or to manage Scheduled Reports. For more information see, Using Scheduled Reports in Flow Monitor: printing, exporting, and emailing reports.
Exporting individual dashboard report data
Use the Export button on a dashboard report's menu to export data to either a text file, Microsoft Excel, or a PDF. For more information, see Exporting report data.