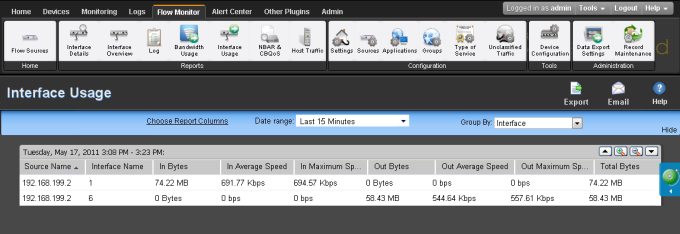
About the Interface Usage report
The Flow Interface Usage report gives a view of the total amount of incoming and outgoing traffic for source interfaces over the selected time period. Interfaces can be displayed separately, or grouped together by interface name. When you group together by interface name, all interfaces under a single display name are added together, and all data displayed is a total for those interfaces.

The report displays the following usage data for each interface.
- Interface Name the display name as configured by the user on the Flow Sources dialog in combination with the interface identifier.
- Incoming Bytes. Displays the number of incoming bytes for that interface or interface name over the selected time period.
- Incoming Average Speed. Displays the incoming rate in a multiple of bytes per second for the interface over the selected time period.
- Incoming 95th Percentile. Displays the results of the 95th percentile calculation for incoming traffic during the selected time period. It is calculated only with raw data, so do not expand the date range to include roll-up data.
- Incoming Maximum Speed. Displays the maximum incoming rate in a multiple of bytes per second achieved during the selected time period.
- Outgoing Bytes. Displays the number of outgoing bytes for that interface or interface name over the selected time period.
- Outgoing Average Speed. Displays the outgoing rate in a multiple of bytes per second for the interface over the selected time period.
- Outgoing 95th Percentile. Displays the results of the 95th percentile calculation for outgoing traffic during the selected time period. It is calculated only with raw data, so do not expand the date range to include roll-up data.
- Outgoing Maximum Speed. Displays the maximum outgoing rate in a multiple of bytes per second achieved during the selected time period.
- Total Bytes. Displays the total number of bytes for that interface or interface name over the selected time period.
By default, the report displays data grouped by interfaces. You can refine the report in several ways.
- Grouping report data. Choose to Group by Interface or Interface Name.
- Selecting a different date range. Use the Date range list at the top of the report to change the timeframe for which report data is displayed. If you select Custom, you will be prompted to enter a start and end time for the date range. For more information, see Filtering by date and time.
Exporting, emailing, scheduling and managing reports
Use the Export ![]() icon, at the top right of the page, to export reports. Use the Email
icon, at the top right of the page, to export reports. Use the Email ![]() icon to E-mail a report or to manage Scheduled Reports. For more information see, Using Scheduled Reports in Flow Monitor: printing, exporting, and emailing reports.
icon to E-mail a report or to manage Scheduled Reports. For more information see, Using Scheduled Reports in Flow Monitor: printing, exporting, and emailing reports.