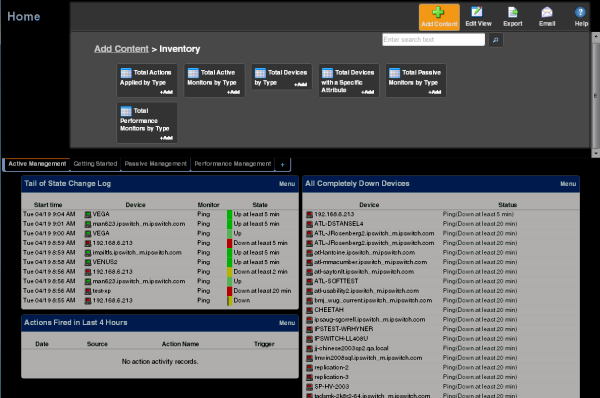
Overview of dashboard report categories
WhatsUp Gold offers a collection of dashboard reports to display in a variety of ways on a dashboard and provide useful network information at a glance. These smaller reports show similar information to that found in the full reports. Because of their smaller size, multiple reports can be placed in a dashboard view, making it possible to view multiple reports simultaneously.
Dashboard reports are broken down into categories according to the type of information they display:
- Alert Center. These dashboard reports display information that pertains to device thresholds and threshold summary information.
- CPU Utilization. These dashboard reports display information that pertains to device and network CPU levels.
- Custom Performance Monitors. These dashboard reports display information that pertains to your custom performance monitors.
- Disk Utilization. These dashboard reports display information that pertains to device and network disk capacity levels.
- ELM. ELM dashboard reports display event summary and event alarm information. To view these reports, you must have WhatsUp Event Log Management.
- Flow Monitor. Flow Monitor dashboard reports display data from Flow Monitor and can be used within Flow Monitor report views and WhatsUp Gold dashboard views.
- General. These dashboard reports display information on your WhatsUp Gold settings and diagnostics, database size, as well as device-specific and user-configured details.
- Interface Errors and Discards. These dashboard reports display information that pertains to device interface data errors and data discards.
- Interface Utilization. These dashboard reports display information that pertains to device and network interfaces.
- Inventory. These dashboard reports provide a break-down of network devices and their settings, including Actions, monitors, and policies.
- Memory Utilization. These dashboard reports display information that pertains to device and network memory levels.
- Performance (Historic and Last Poll). These dashboard reports display information gathered from WMI and SNMP Performance Monitors regarding your network devices' CPU, disk, interface, and memory utilization; and ping latency and availability.
- Ping Availability and Response Time. These dashboard reports display information that pertains to device ping availability, response time, and packet loss.
- Problem Areas. These are trouble-shooting dashboard reports that allow you to investigate network issues.
- Remote/Central (included in the WhatsUp Gold Distributed, and MSP Editions). These include a variety of dashboard reports for the Remote Sites that you are monitoring with the WhatsUp Gold Central Site.
- Split Second Graphs Split Second Graphs (included in the WhatsUp Gold Premium, Distributed, and MSP Editions). These are real-time graphs that display information on SNMP and WMI performance counters. These reports allow you to include the real-time information available on the Web Performance Monitor network tool and the Web Task Manager network tool in any dashboard view.
- Threshold. These dashboard reports display information on your network CPU, disk, interface, and memory utilization, and ping function; at or above a specific threshold.
- Top 10. These dashboard reports display the top devices on your network according to their CPU, disk, interface, and memory utilization, and ping function.
- Virtualization. These dashboard reports display information about vCenter servers, virtual hosts and their associated virtual machines. You can see details about the virtual host or vCenter server, a list of the virtual machines, as well as CPU, disk, interface, and memory utilization for virtual machines.
- Wireless (included in the WhatsUp Gold Premium, Distributed, and MSP Editions). These dashboard reports display information about Wireless Access Point (WAP) devices and the devices connected to the WAPs, transmit and receive errors, and syslog messages.
Dashboard reports are listed multiple times in the Add Content pane. For example, the Disk Utilization dashboard report is listed under the Disk Utilization, Threshold, Top 10, and Performance categories.
