Using the Flow Monitor Home page right-click menu
From the Flow Monitor Home page, you can right-click on a source or interface to access a right-click menu with links to common tasks.
Note: The right-click menu shows options available for the object on which you right-click. Depending on the object you right-click, the available options may vary.
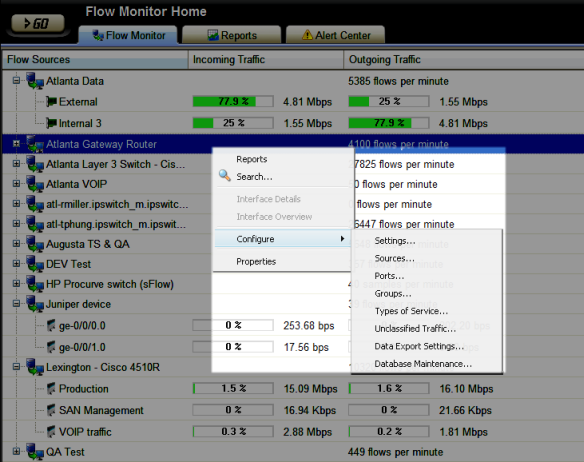
The right-click menu includes these options:
- Reports. Select this option to open the Reports tab.
- Host Search. Select this option to open the Host Search dialog. From this dialog, you can search all sources and interfaces for traffic that uses a specific host. For more information, see Searching for specific hosts.
- Interface Details. Select this option to view the Interface Details report for the selected interface. This report is a collection of views that provide quick insight into the traffic transmitting across a specific interface.
- Interface Overview. Select this option to view the Interface Overview report for the selected interface. This report is a collection of Flow Monitor workspace reports that provide a summary of the traffic and utilization of a specific interface.
- Configure. Select a configuration option:
- Flow Settings. Select this option to configure general settings in the Flow Settings dialog.
- Flow Sources. Select this option to open the Flow Sources dialog. From this dialog, you can view and change a device source configuration or stop and start data collection from a source, select a source and click Edit.
- Flow Ports. Select this option to open the Flow Ports dialog. From this dialog, you can see the definitions of applications (traffic over a given port using one or more protocols) that Flow Monitor is monitoring. You can also use this dialog to define new applications.
- Flow Groups. Select this option to open the Flow Groups dialog. From this dialog, you can create, change, or delete an IP range of devices, in a Flow Group, that may not have been automatically associated with a domain, top level domain, or country.
- Flow Types of Service. Select this option to open the Flow Types of Service dialog. From this dialog, you can view and rename Flow Types of Service to make the Flow Top Types of Service workspace report more meaningful and easy to identify.
- Flow Unclassified Traffic. Select this option to open the Flow Unclassified Traffic dialog. From this dialog, you can map ports that have not been mapped to an application and are currently unmonitored.
- Flow Data Export Settings. Select this option to configure the parameters for exporting Flow Monitor report data.
- Properties. Select this option to open either the Flow Source Properties dialog, or the Flow Interface Properties dialog. From these dialogs, you can view information about the selected source or interface properties.