Learning about full reports
Full reports are used to troubleshoot and monitor performance and historical data that has been collected during the operation of the application.

From the WhatsUp Gold console, you can access full reports by clicking the Reports ![]() button on the console toolbar.
button on the console toolbar.
Report categories
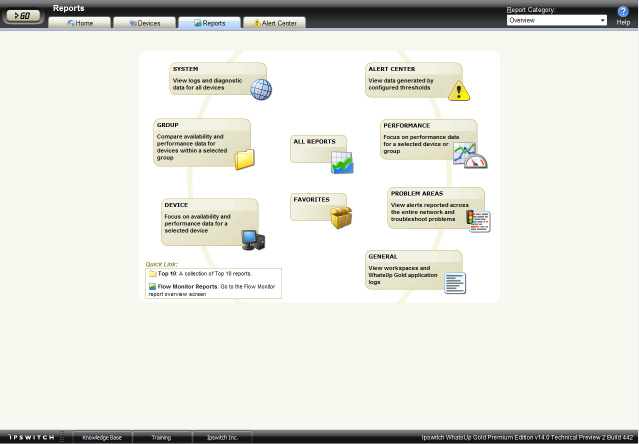
Reports in WhatsUp Gold are broken down by the scope and the type of information displayed within each report.
There are three categories for full reports based on the scope of information displayed:
- System. These reports display system-wide information. System reports do not focus on a particular device nor a specific device group. For example, the General Error Log and the Web User Activity Log are system reports.
- Group. These reports display information relating to a specific device group. For example, the Group State Change Timeline and the Group Actions Applied reports are group reports.
- Device. These reports display information relating to a specific device. For example, the Device Status Report is a device report.
There are three categories for full reports based on the type of information displayed:
- Performance. These reports display information gathered from WMI and SNMP Performance Monitors regarding your network devices' CPU, disk, interface, and memory utilization; and ping latency and availability. For example, the Device Custom Performance Monitors and the Group Memory Utilization reports are performance reports.
Note: By default, performance data is not collected for the monitors assigned to the devices in your database. To begin collecting performance data for a device, right-click on a device on the Devices tab and select Properties from the context menu. In the Device Properties dialog, select Performance Monitors and choose the monitors you want to apply to the selected device.
- Problem Areas. These are troubleshooting reports that allow you to investigate network issues. For example, the Group Active Monitor Outage and the Passive Monitor Error Log are problem area reports.
- General. These reports display information on your WhatsUp Gold settings and diagnostics, as well as device-specific and user-configured details. For example, the Home, Top 10, and Device Status workspaces/full reports are general reports.
Advantages of full Reports
- Larger than workspace reports, full reports give you a larger data view, which can be useful in pin-pointing the time an event occurred or viewing multiple graphed items. Many workspace reports link to full reports, so that you can view this larger data view to troubleshoot.
- The date range on full reports can be zoomed in or out so that you can get a smaller or larger picture of what's going on with an aspect of the network.
- A list in the upper-right corner of a full report screen allows you to navigate to other reports in the same category. When you use this list to navigate to another report, the date range selected in the report you are navigating away from is transferred to any report you view subsequently.
- Much of the data in full reports can be exported to a formatted text file, Microsoft Excel, or a PDF. You can also email reports as a PDF, or send on scheduled intervals.