Threshold Summary
Threshold Summary report reveals the unresolved item count for each threshold type and provides drill down into device monitoring details.
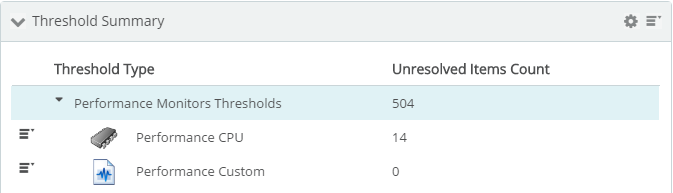
- Threshold Type. Thresholds are grouped by type; Network Traffic Analysis, Passive Monitor, Performance Monitor, System, and Wireless. Specific thresholds are listed under each threshold type.
- Unresolved Items Count. Displays the number of unresolved items for each threshold.
Generate a report
 Filter and reduce by row and by column.
 ![]() Sort and remove columns, group rows based on specific column values, remove and remove noise and chaff from the table.
Sort and remove columns, group rows based on specific column values, remove and remove noise and chaff from the table.
 and use the following from the drop down list:
Rename Report. ![]() Edit report name using the Report Settings
Edit report name using the Report Settings ![]() dialog.
dialog.
Share, export, and save as PDF
Most generated Threshold Summary report data can be printed, shared, and exported when selecting Expand (![]() ) from the Dashboard Options (
) from the Dashboard Options (![]() ) menu. After the report has been expanded, select export (
) menu. After the report has been expanded, select export (![]() ) to access the following options:
) to access the following options:
- Export to PDF. Save grid and chart views as PDF.
- Export Data. Export Threshold Summary data and leverage outside of WhatsUp Gold.
- Schedule Export. Set a recurring date and time, format, and email destination for report data export.